
Jordan Ellenberg has written a wonderful book,How Not to Be Wrong: The Power of Mathematical Thinking (Penguin, 2014).
Steven Pinker comments:
Like Lewis Carroll, George Gamow, and Martin Gardner before him, Jordan Ellenberg shows how mathematics can delight and stimulate the mind. But he also shows that mathematical thinking should be in the toolkit of every thoughtful person–of everyone who wants to avoid fallacies, superstitions, and other ways of being wrong.
Here’s the outline:
-
- When Am I Going to Use This?
PART I. LINEARITY
-
- One. Less Like Sweden
- Two. Straight Locally, Curved Globally
- Three. Everyone is Obese
- Four. How Much Is That in Dead Americans?
- Five. More Pie Than Plate
PART II. INFERENCE
-
- Six. The Baltimore Stockbroker and the Bible Code
- Seven. Dead Fish Don’t Read Minds
- Eight. Reductio Ad Unlikely
- Nine. The International Journal of Haruspicy
- Ten. Are You There God? It’s Me, Bayesian Inference
PART III. EXPECTATION
-
- Eleven. What to Expect When You’re Expecting to Win the Lottery
- Twelve. Miss More Planes!
- Thirteen. Where the Train Tracks Meet
PART IV. REGRESSION
-
- Fourteen. The Triumph of Mediocrity
- Fifteen. Galton’s Ellipse
- Sixteen. Does Lung Cancer Make You Smoke Cigarettes?
PART V. EXISTENCE
-
- Seventeen. There Is No Such Thing as Public Opinion
- Eighteen. “Out of Nothing I Have Created a Strange New Universe”
-
- How to Be Right
WHEN AM I GOING TO USE THIS?
Ellenburg tells the story of Abraham Wald.
This story, like many World War II stories, starts with the Nazis hounding a Jew out of Europe and ends with the Nazis regretting it…. He was the grandson of a rabbi and the son of a kosher baker, but the younger Wald was a mathematician almost from the start. His talent for the subject was quickly recognized, and he was admitted to study mathematics at the University of Vienna, where he was drawn to subjects abstract and recondite even by the standards of pure mathematics: set theory and metric spaces.
In the mid-1930s, Austria was in economic distress and it wasn’t possible for a foreigner to be hired as a professor. Wald ended up taking a job at the Cowles Commission, an economic institute then in Colorado Springs. A few months later, Wald was offered a professorship of statistics at Columbia University. When World War II came, the Statistical Research Group was formed.
The Statistical Research Group (SRG), where Wald spent much of World War II, was a classified program that yoked the assembled might of American statisticians to the war effort–something like the Manhattan Project, except the weapons being developed were equations, not explosives.
The mathematical talent at SRG was extraordinary.
Frederick Mosteller, who would later found Harvard’s statistics department, was there. So was Leonard Jimmy Savage, the pioneer of decision theory and great advocate of the field that came to be called Bayesian statistics. Norbert Wiener, the MIT mathematician and the creator of cybernetics, dropped by from time to time. This was a group where Milton Friedman, the future Nobelist in economics, was often the fourth-smartest person in the room.
The smartest person in the room was usually Abraham Wald.
Planes need armor in order to lessen their chance of being shot down. You don’t want too much armor due to the added weight, but you also don’t want too little armor, causing more planes to be shot down. So there was a question about where to put extra armor on the planes.
The planes that came back had bullet holes per square foot distributed as follows: 1.11 for the engine, 1.73 for the fuselage, 1.55 for the fuel system, and 1.8 for the rest of the plane.
Given this knowledge, where should you put the extra armor? At first glance, you might think the added armor should not be on the engine or fuel system, but on the fuselage and the rest of the plane. However, Wald said the extra armor should go not where the bullet holes are, but where they aren’t: on the engines. Why? Because you have to consider the planes that never made it back. Those planes had bullet holes on the engines, which is why they never made it back. Ellenberg comments:
If you go to the recover room at the hospital, you’ll see a lot more people with bullet holes in their legs than people with bullet holes in their chests.
That’s because the people shot in the chest generally don’t recover. Ellenberg again:
One thing the American defense establishment has traditionally understood very well is that countries don’t win wars just by being braver… The winners are usually the guys who get 5% fewer of their planes shot down, or use 5% less fuel, or get 5% more nutrition into their infantry at 95% of the cost. That’s not the stuff war movies are made of, but it’s the stuff wars are made of. And there’s math every step of the way.
The reason Wald figured out where to put the armor was due to his mathematical training.
A mathematician is always asking, “What assumptions are you making? Are they justified?”
The officers were assuming that the planes that returned were a random sample of all planes. But this wasn’t the case. There was no reason to assume the planes had an equal chance of survival no matter where they had been hit.
Ellenberg asserts:
Mathematics is the extension of common sense by other means.
Ellenberg again:
Mathematics is the study of things that come out a certain way because there is no other way they could possibly be.
For example:
…we have built-in mental systems for assessing the likelihood of an uncertain outcome. But those systems are pretty weak and unreliable, especially when it comes to events of extreme rarity. That’s when we shore up our intuition with a few sturdy, well-placed theorems and techniques, and make out of it a mathematical theory of probability.
(Gaussian normal distribution, Illustration by Peter Hermes Furian)
The specialized language in which mathematicians converse with one another is a magnificent tool for conveying complex ideas precisely and swiftly. But its foreignness can create among outsiders the impression of a sphere of thought totally alien to ordinary thinking. That’s exactly wrong.
Math is like an atomic-powered prosthesis that you attach to your common sense, vastly multiplying its reach and strength. Despite the power of mathematics, and despite its sometimes forbidding notation and abstraction, the actual mental work involved is little different from the way we think about more down-to-earth problems.
Ellenberg continues:
Mathematics is not settled. Even concerning the basic objects of study, like numbers and geometric figures, our ignorance is much greater than our knowledge. And the things we do know were arrived at only after massive effort, contention, and confusion. All this sweat and tumult is carefully screened off in your textbook.
Ellenberg then explains that mathematical facts can be simple or complicated, and they can be shallow or profound. The focus of the book is on the simple yet profound. These tools can help you not be wrong.
Ellenberg mentions his own experience:
As a graduate student, I dedicated myself to number theory, what Gauss called “the queen of mathematics,” the purest of the pure subjects, the sealed garden at the center of the convent, where we contemplated the same questions about numbers and equations that troubled the Greeks and have gotten hardly less vexing in the twenty-five hundred years since.
Ellenberg then adds:
But something funny happened. The more abstract and distant from lived experience my research got, the more I started to notice how much math was going on in the world outside the walls. Not Galois representations or cohomology, but ideas that were simpler, older, and just as deep… I started writing articles for magazines and newspapers about the way the world looked through a mathematical lens, and I found, to my surprise, that even people who said they hated math were willing to read them.
PART I: LINEARITY
ONE: LESS LIKE SWEDEN
Daniel J. Mitchell of the libertarian Cato Institute wrote a blog post in 2012, during the battle over the Affordable Care Act. The blog post was titled, “Why Is Obama Trying to Make America More Like Sweden when Swedes Are Trying to Be Less Like Sweden?” Mitchell writes: “If Swedes have learned from their mistakes and are now trying to reduce the size and scope of government, why are American politicians determined to repeat those mistakes?”
The answer has to do with a nonlinear relationship between prosperity and Swedishness, writes Ellenberg. It’s false to say that reducing the size of government automatically increases prosperity, just as it’s false to say that increasing the size of government automatically increases prosperity. Arguably, there’s an optimal size for government that America is below and that Sweden is above.
TWO: STRAIGHT LOCALLY, CURVED GLOBALLY
Ellenberg continues the theme of nonlinearity:
You might not have thought you needed a professional mathematician to tell you that not all curves are straight lines. But linear reasoning is everywhere. You’re doing it every time you say that if something is good to have, having more of it is even better.
Ellenberg points out that if you look at one section of a curve very closely, it looks like a line. Ellenberg explains calculus by using the example of a missile that follows a curved path due to gravity:
Now here’s the conceptual leap. Newton said, look, let’s go all the way. Reduce your field of view until it’s infinitesimal–so small that it’s smaller than any size you can name, but not zero. You’re studying the missile’s arc, not over a very short time interval, but at a single moment. What was almost a line becomes exactly a line. And the slope of this line is what Newton called the fluxion, and what we’d now call the derivative.
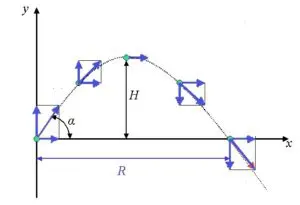
(Projectile motion illustration by Ayush12gupta, via Wikimedia Commons)
Ellenberg introduces Zeno’s paradox. In order to walk from one place to another place, first you must walk half the distance. Then you must walk half of the remaining distance. After that, in order to get to your destination, you must walk half of the remaining distance. Thus it seems you can never reach your destination. To go anywhere, first you must go half way there, then you must cover half the remaining distance, ad infinitum. Ellenberg observes that all motion is ruled out. To wave your hand, first you must raise your hand. To do that, first you must raise it halfway, etc.
What’s the solution? Ellenberg says to consider the infinite series:
1/2 + 1/4 + 1/8 + 1/16 + 1/32 + ….
If you add up the first twenty terms, you get 0.999999. If you keep adding terms, you get 0.9999….., which doesn’t end. But is 0.9999… equal to 1?
Ellenberg says to consider that
0.3333…. = 1/3
Multiply both sides by 3:
0.9999…. = 1
You could also do it this way, multiplying 0.9999…. by 10:
10 x (0.9999…) = 9.9999….
Subtract the decimal from both sides:
10 x (0.9999…) – 1 x (0.9999…) = 9.9999… – 0.9999…
9 x (0.9999…) = 9
This still doesn’t fully answer the question because we assume that 0.3333… = 1/3, which one could argue is not quite true.
Ellenberg presents another brain teaser:
1 + 2 + 4 + 8 + 16 + 32 + ….
What does this series equal? It must be infinite, right?
What if you multiplied it by 2:
2 x (1 + 2 + 4 + 8 + …) = 2 + 4 + 8 + 16 + …
It looks like the same series but without the 1 at the beginning. That implies:
2 x (1 + 2 + 4 + 8 + …) – 1 x (1 + 2 + 4 + 8 + …) = –1
Which means:
1 + 2 + 4 + 8 + … = –1
Really? Here’s another interesting example:
1 – 1 + 1 – 1 + 1 – 1 + …
It looks like:
(1 – 1) + (1 – 1) + (1 – 1) + … = 0 + 0 + 0 + … = 0
But it also can be written:
1 – (1 – 1) – (1 – 1) – (1 – 1) = 1 – 0 – 0 – 0 = 1
If you define T as:
T = 1 – 1 + 1 – 1 + 1 – 1 + …
Then take the negative of both sides:
–T = – 1 + 1 – 1 + 1 … = T – 1
Then you get –2T = –1, or T = 1/2.
Now back to the infinite series:
0.9999….
Augustin-Louis Cauchy introduced the idea of limit into calculus in the 1820s. Ellenberg:
The sum 0.9 + 0.09 + 0.009 + … gets closer and closer to 1 the more terms you add. And it never gets any farther away. No matter how tight a cordon we draw around the number 1, the sum will eventually, after some finite number of steps, penetrate it, and never leave. Under those circumstances, Cauchy said, we should simply define the value of the infinite sum to be 1. And then he worked very hard to prove that committing oneself to this definition didn’t cause horrible contradictions to pop up elsewhere. By the time this labor was done, he’s constructed a framework that made Newton’s calculus completely rigorous. When we say a curve looks locally like a straight line at a certain angle, we now mean more or less this: as you zoom in tighter and tighter, the curve resembles the given line more and more closely.
So we can take 1 and 0.999… to be equal. Ellenberg concludes:
One of the great joys of mathematics is the incontrovertible feeling that you’ve understood something the right way, all the way down to the bottom; it’s a feeling I haven’t experienced in any other sphere of mental life.
THREE: EVERYONE IS OBESE
Ellenberg read an article about Americans getting more obese. The article concludes that if this trend continues, ALL Americans will be obese by 2048.
As another example of linear regression, Ellenberg asks the reader to consider the relationship between SAT scores and tuition. Generally, the higher the average SAT score, the higher the tuition. What is linear regression?
…if you replace the actual tuition with the estimate the line suggests, and then you compute the difference between the estimated and the actual tuition for each school, and then you square each of these numbers, and you add all those squares up, you get some kind of total measure of the extent to which the line misses the points, and you choose the line that makes this measure as small as possible. This business of summing squares smells like Pythagoras, and indeed the underlying geometry of linear regression is no more than Pythagoras’s theorem transposed and upgraded to a much-higher-dimensional setting…
Here’s an example of linear regression:
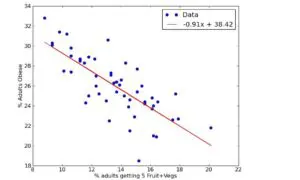
(Least squares fit by Prof. Boykin, via Wikimedia Commons)
Ellenberg continues:
Linear regression is a marvelous tool, versatile, scalable, and as easy to execute as clicking a button on your spreadsheet. You can use it for data involving two variables… but it works just a well for three variables, or a thousand. Whenever you want to understand which variables drive which other variables, and in which direction, it’s the first thing you reach for. And it works on any data set at all.
However, linear regression is a tool that can be misused if it is applied to phenomena that aren’t linear.
Back to obesity: Overweight means having a body-mass index of 25 or higher.
In the early 1970s, just under half of Americans had a BMI that high. By the early 1990s that figure had risen to almost 60%, and by 2008 almost three-quarters of the U.S. population was overweight.
If you extrapolate the trend, you conclude that ALL Americans will be overweight by 2048. That doesn’t make sense.
FOUR: HOW MUCH IS THAT IN DEAD AMERICANS?
Ellenberg writes:
How bad is the conflict in the Middle East? Counterterrorism specialist Daniel Byman of Georgetown University lays down some cold, hard numbers in Foreign Affairs: “The Israeli military reports that from the start of the second intifada [in 2000] through the end of October 2005, Palestinians killed 1,074 Israelis and wounded 7,520–astounding figures for such a small country, the proportional equivalent of more than 50,000 dead and 300,000 wounded for the United States.”
Ellenberg adds:
Eventually (or perhaps immediately?) this reasoning starts to break down. When there are two men left in the bar at closing time, and one of them coldclocks the other, it is not the equivalent in context to 150 million Americans getting simultaneously punched in the face.
Or: when 11% of the population of Rwanda was wiped out in 1994, all agree that it was among the worst crimes of the century. But we don’t describe the bloodshed there by saying, “In the context of 1940s Europe, it was nine times as bad as the Holocaust.”
As a proportion of the population, South Dakota has a high degree of brain cancer while North Dakota has a low degree of it. Similarly, Maine has a high degree of brain cancer while Vermont has a low degree of it. This seems strange.
To understand what’s doing on, Ellenberg considers coin flipping. If you flip one coin ten times, you may get 8 or 9 heads, which is a proportion of 80% or 90%. But if you flip a coin one hundred times, you’ll never get 80% heads unless you repeat the flipping a few billion times.

What causes a large number of coin tosses to move toward 50%? The Law of Large Numbers. Ellenberg:
…if you flip enough coins, there’s only the barest chance of getting as many as 51%. Observing a highly unbalanced result in ten flips is unremarkable; getting the same proportional imbalance in a hundred flips would be so startling as to make you wonder whether someone has mucked with your coins.
In 1756, Abraham de Moivre published The Doctrine of Chances. De Moivre wanted to know how close to 50% heads you would get if you flipped a large number of coins.
De Moivre’s insight is that the size of the typical discrepancy is governed by the square root of the number of coins you toss. Toss a hundred times as many coins as before and the typical discrepancy grows by a factor of 10–at least, in absolute terms. As a proportion of the total number of tosses, the discrepancy shrinks as the number of coins grows, because the square root of the number of coins grows much more slowly than does the number of coins itself.
…if you want to know how impressed to be by a good run of heads, you can ask how many square roots away from 50% it is. The square root of 100 is 10. So when I got 60 heads in 100 tries, that was exactly one square root away from 50-50. The square root of 1,000 is about 31; so when I got 538 heads in 1,000 tries, I did something even more surprising, even though I got only 53.8% heads in the latter case and 60% heads in the former.
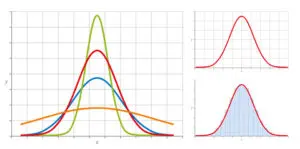
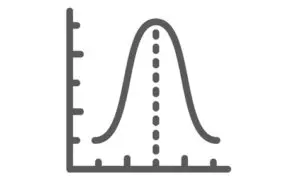
But de Moivre wasn’t done. He found that the discrepancies from 50-50, in the long run, always tend to form themselves into a perfect bell curve, or, as we call it in the biz, the normal distribution.
Ellenberg continues:
The bell curve… is tall in the middle and very flat near the edges, which is to say that the farther a discrepancy is from zero, the less likely it is to be encountered. And this can be precisely quantified.
One common misperception is the so-called law of averages (which Ellenberg points out is not well-named because laws should be true but the law of averages is false). If you flip ten heads in a row, what are the odds that the next flip will be heads? Based on the Law of Large Numbers, you might think the next flip is extremely likely to be tails. But it’s not. It’s still only 50% likely to be tails and 50% likely to be heads. Ellenberg explains:
The way the overall proportion settles down to 50% isn’t that fate favors tails to compensate for the heads that have already landed; it’s that those first ten flips become less and less important the more flips we make. If I flip the coin a thousand more times, and get about half heads, then the proportion of heads in the first 1,010 flips is also going to be close to 50%.
So can wars and other violent events be compared based on proportion of population? Ellenberg concludes the chapter:
Most mathematicians would say that, in the end, the disasters and the atrocities of history form what we call a partially ordered set. That’s a fancy way of saying that some pairs of disasters can be meaningfully compared and others cannot. This isn’t because we don’t have accurate enough death counts, or firm enough opinions as to the relative merits of being annihilated by a bomb versus dying of war-induced famine. It’s because the question of whether one war was worse than another is fundamentally unlike the question of whether one number is bigger than another. The latter question always has an answer. The former does not.
FIVE: MORE PIE THAN PLATE
Ellenberg writes:
Between 1990 and 2008, the U.S. economy gained a net 27.3 million jobs. Of those, 26.7 million, or 98%, came from the “nontradable sector”: the part of the economy including things like government, health care, retail, and food service, which can’t be outsourced and which don’t produce goods to be shipped overseas.
…So [is] growth as concentrated in the nontradable part of the economy as it could possibly be? That’s what it sounds like–but that’s not quite right. Jobs in the tradable sector grew by a mere 620,000 between 1990 and 2008, that’s true. But it could have been worse–they could have declined! That’s what happened between 2000 and 2008; the tradable sector lost about 3 million jobs, while the nontradable sector added 7 million. So the nontradable sector accounted for 7 million jobs out of the total gain of 4 million, or 175%!
The slogan to live by here is:
Don’t talk about percentages of numbers when the numbers might be negative.
Ellenberg gives the example of a coffee shop. Say he lost $500 on coffee, but made $750 on a pastry case and $750 on a CD Rack. Overall, he made $1,000. 75% of profits came from the pasty case. Or you could say that 75% of profits came from the CD rack. To say either one is misleading.
This problem doesn’t happen with numbers that have to be positive, like revenues.
Consider growth in income from 2009 to 2010, says Ellenberg. 93% of additional income went to the top 1% of taxpayers. 17% of additional income went to those in the top 10%, but not the top 1%, of taxpayers. How does that make sense? Again, because of a negative number: the bottom 90% of taxpayers saw their incomes move lower.
PART II: INFERENCE
SIX: THE BALTIMORE STOCKBROKER AND THE BIBLE CODE
Ellenberg observes that mathematics is used for a wide range of things, from when the next bus can be expected to what the universe looked like three trillionths of a second after the Big Bang. But what about questions concerning God and religion? Ellenberg:
Never underestimate the territorial ambitions of mathematics! You want to know about God? There are mathematicians on the case.
The rabbinical scholar focuses on the Torah, notes Ellenberg. A group of researchers at Hebrew University–senior professor of mathematics Eliyahu Rips, graduate student in computer science Yoav Rosenberg, and physicist Doron Witztum–started examining the Torah. Specifically, they looked at “equidistant letter sequence,” or ELS. The question they asked was:
Do the names of the rabbis appear in equidistant letter sequences unusually close to their birth and death dates?
Put differently: Did the Torah know the future?
Ellenberg:
First they searched the book of Genesis for ELSs spelling out the rabbis’ names and dates, and computed how close in the text the sequences yielding the names were to the ones yielding the corresponding dates. Then they shuffled the thirty-two dates, so that each one was now matched with a random rabbi, and they ran the test again. Then they did the same thing a million times. If there were no relation in the Torah’s text between the names of the rabbis and the corresponding dates, you’d expect the true matching between rabbis and dates to do about as well as one of the random shuffles. That’s not what they found. The correct association ended up very near the top of the rankings, notching the 453rd highest score among the 1 million contenders.
American journalist Michael Drosnin heard about the Witztum paper. Drosnin started looking for ELSs, but without scientific constraint. Drosnin published The Bible Code, which claimed to predict Yitzhak Rabin’s assassination, the Gulf War, and the 1994 collision of Comet Shoemaker-Levy 9 with Jupiter. Rips, Rosenberg, and Witztum denounced Drosnin’s ad hoc method. But The Bible Code became a bestseller.
At the same time as the bible codes were being accepted by the public, the Witztum paper came under severe criticism from mathematicians including Shlomo Sternberg of Harvard University. To understand the criticism, Ellenberg tells the story of the Baltimore stockbroker.
What if you got an unsolicited letter from a Baltimore stockbroker saying that a certain stock would rise, and then it does? Further assume that each week, for ten weeks, you get a new letter predicting some stock to rise or fall, and each week, the prediction is correct. The eleventh week, the Baltimore stockbroker asks you to invest money with him.
Now, what are the odds that the Baltimore stockbroker got ten straight predictions right due to chance alone? Those odds can be computed:
(1/2) x (1/2) x (1/2) x (1/2) x (1/2) x (1/2) x (1/2) x (1/2) x (1/2) x (1/2) = 1/1024
However, what you didn’t know was that the Baltimore stockbroker mailed 10,240 letters the first week, half predicting a rise in a specific stock and half predicting a fall in that same stock. So that first week, there were 5,120 correct predictions. At that point, the stockbroker mails out 5,120 new letters, half of which predict a rise in some stock and half of which predict a fall. After that second week, there are 2,560 people who have seen two correct predictions in a row. And thus the Baltimore stockbroker continues until, after ten weeks, there are 10 people who received by mail 10 straight correction predictions.
Some companies will launch multiple mutual funds at the same time, experimenting with different strategies before advertising any fund to the public. The funds that do well during this initial period–called incubation–are then marketed to the public, while the funds that don’t do well are quietly closed (and often these funds are not noticed by the public). Subsequently, the surviving funds do not perform better than the median, which suggests the part of their early outperformance was simply due to chance.
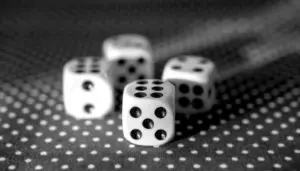
(Photo by Martinlisner)
The general lesson, writes Ellenberg, is:
Improbable things happen a lot.
In other words, a great many things are due largely to chance, therefore there will always be improbable things happening.
Criticism of the Witztum paper came from Brendan McKay, an Australian computer scientist, and Dror Bar-Natan, an Israeli mathematician then at Hebrew University. They pointed out that the rabbis didn’t have birth certificates or passports, so they were known by many different names. Why did the Witztum paper, for each rabbi studied, use specific appellations but not others? Ellenberg:
McKay and Bar-Natan found that wiggle room in the choices of names led to drastic changes in the quality of the results. They made a different set of choices about the appellations of the rabbis; their choices, according to biblical scholars, make just as much sense as the ones picked by Witztum… And they found that with the new list of names, something quite amazing transpired. The Torah no longer seemed to detect the birth and death dates of the rabbinic notables. But the Hebrew edition of War and Peace nailed it, identifying the rabbis with their correct dates about as well as the book of Genesis did in the Witztum paper.
What’s going on? Ellenberg:
It is very unlikely that any given set of rabbinic appellations is well matched to birth and death dates in the book of Genesis. But with so many ways of choosing the names, it’s not at all improbable that among all the choices there would be one that made the Torah look uncannily prescient.
Obviously it’s also not the case that Tolstoy composed his novel with the names of rabbis concealed in it, to be later revealed when modern Hebrew was invented and the novel was translated into it.
SEVEN: DEAD FISH DON’T READ MINDS
At the 2009 Organization for Human Brain Mapping conference in San Francisco, UC Santa Barbara neuroscientist Craig Bennett presented his finding that a dead salmon was able to read human emotions.
A dead fish, scanned in an fMRI device, was shown a series of photographs of human beings, and was found to have a surprisingly strong ability to correctly assess the emotions the people in the pictures displayed.
What?! Here’s what’s going on:
…the nervous system is a big place, with tens of thousands of voxels to choose from. The odds that one of those voxels provides data matching up well with the photos is pretty good… The point of Bennett’s paper is to warn that the standard methods of assessing results, the way we draw our thresholds between a real phenomenon and random static, come under dangerous pressure in this era of massive data sets, effortlessly obtained. We need to think very carefully about whether our standards for evidence are strict enough, if the empathetic salmon makes the cut.
Ellenberg adds:
The really surprising result of Bennett’s paper isn’t that one or two voxels in a dead fish passed a statistical test; it’s that a substantial proportion of the neuroimaging articles he surveyed didn’t use statistical safeguards (known as “multiple comparisons correction”) that take into account the ubiquity of the improbable. Without those corrections, scientists are at serious risk of running the Baltimore stockbroker con, not only on their colleagues but on themselves.
The null hypothesis is the hypothesis that the intervention you’re studying has no effect, notes Ellenberg.
To test your intervention, you have to run a null hypothesis significance test. Ellenberg:
It goes like this. First, you have to run an experiment. You might start with a hundred subjects, then randomly select half to receive your proposed wonder drug while the other half gets a placebo…
From here, the protocol might seem simple: if you observe fewer deaths among the drug patients than the placebo patients, declare victory and file a marketing application with the FDA. But that’s wrong. It’s not enough that the data be consistent with your theory; they have to be inconsistent with the negation of your theory, the dreaded null hypothesis.
Assuming the null hypothesis, the chance of death (assume 10%) is exactly the same for the patients who got the drug and the patients who got the placebo. That doesn’t mean that exactly five patients will die in each category. Under the null hypothesis, Ellenberg says there is:
-
- 13.3% chance equally many drug and placebo patients die
- 43.3% chance fewer placebo patients than drug patients die
- 43.3% chance fewer drug patients than placebo patients die
So drug patients doing better than placebo patients is not necessarily significant. But what if drug patients do A LOT better, asks Ellenberg. Assume, for example, that none of the drug patients die. What are the odds that the could happen under the null hypothesis?
Under the null hypothesis, here’s a 90% chance that a patient will survive. What are the odds that all fifty survive?
0.9 x 0.9 x 0.9 x … fifty times! … x 0.9 x 0.9 = 0.00515…
Under the null hypothesis, there is only one chance in two hundred of getting results this good, observes Ellenberg.
So here’s the procedure for ruling out the null hypothesis…:
-
- Run an experiment.
- Suppose the null hypothesis is true, and let p be the probability (under that hypothesis) of getting results as extreme as those observed.
- The number p is called the p-value. If it is very small, rejoice; you get to say your results are statistically significant. If it is large, concede that the null hypothesis has not been ruled out.
EIGHT: REDUCTIO AD UNLIKELY
Ellenberg points out that assuming the null hypothesis, which we believe is false, might seem questionable. But the reductio ad absurdum goes all the way back to Aristotle. If a hypothesis implies a falsehood, then the hypothesis must be false. The reduction ad absurdum looks like this:
-
- Suppose the hypothesis H is true.
- It follows from H that a certain fact F cannot be the case.
- But F is the case.
- Therefore, H is false.
Ellenberg then describes what he calls a reductio ad unlikely:
-
- Suppose the null hypothesis H is true.
- It follows from H that a certain outcome O is very improbable (say, less than Fisher’s 0.05 threshold).
- But O was actually observed.
- Therefore, H is very improbable.

NINE: THE INTERNATIONAL JOURNAL OF HARUSPICY
Ellenberg writes about haruspicy:
…If the null hypothesis is always true–that is, if haruspicy is undiluted hocus-pocus–then only 1 in 20 experiments will be publishable.
And yet there are hundreds of haruspices, and thousands of ripped-open sheep, and even one in twenty divinations provides plenty of material to fill each issue of the journal with novel results, demonstrating the efficacy of the methods and the wisdom of the gods. A protocol that worked in one case and gets published usually fails when another haruspex tries it; but experiments without statistically significant results don’t get published, so no one ever finds out about the failure to replicate. And even if word starts getting around, there are always small differences the experts can point to that explain why the follow-up study didn’t succeed; after all, we know the protocol works, because we tested it and it had a statistically significant effect!
Ellenberg then makes his main point:
Modern medicine and social science are not haruspicy. But a steadily louder drum circle of dissident scientists has been pounding out an uncomfortable message in recent years: there’s probably a lot more entrail reading in the sciences than we’d like to admit.
The loudest drummer is John Ioannidis, a Greek high school math star turned biomedical researcher whose 2005 paper “Why Most Published Research Findings Are False” touched off a fierce bout of self-criticism (and a second wave of self-defense) in the clinical sciences… Ioannidis takes seriously the idea that entire specialties of medical research are “null fields,” like haruspicy, in which there are simply no actual effects to be found. “It can be proven,” he writes, “that most claimed research findings are false.”
Ellenberg:
…In a 2012 study, scientists at the California biotech company Amgen set out to replicate some of the most famous experimental results in the biology of cancer, fifty-three studies in all. In their independent trials, they were able to reproduce only six.
How can this have happened? It’s not because genomicists and cancer researchers are dopes. In part, the replicability crisis is simply a reflection of the fact that science is hard and that most ideas we have are wrong–even most of those ideas that survive a first round of prodding.
Ellenberg again:
Suppose you tested twenty genetic markers to see whether they were associated with some disorder of interest, and you found just one result that achieved p < .05 significance. Being a mathematical sophisticate, you’d recognize that one success in twenty is exactly what you’d expect if none of the markers had any effect…
All the more so if you tested the same gene, or the green jelly bean, twenty times and got a statistically significant effect just once.
But what if the green jelly bean were tested twenty times by twenty different research groups in twenty different labs? Nineteen of the labs find no significant statistical effect. They don’t write up their results… The scientists in the twentieth lab, the lucky ones, find a statistically significant effect, because they got lucky–but they don’t know they got lucky.
It can be difficult for scientists when the results seem to be statistically insignificant. Ellenberg:
If you run your analysis and get a p-value of .06, you’re supposed to conclude that your results are statistically insignificant. But it takes a lot of mental strength to stuff years of work in the file drawer… Give yourself license to tweak and shade the statistical tests you carry out on your results, and you can often get that .06 down to a .04. Uri Simonsohn, a professor at Penn who’s a leader in the study of replicability, calls these practices “p-hacking.” Hacking the p isn’t usually as crude as I’ve made it out to be, and it’s seldom malicious. The p-hackers truly believe in their hypotheses, just as the Bible coders do, and when you’re a believer, it’s easy to come up with reasons that the analysis that gives a publishable p-value is the one you should have done in the first place.
But everybody knows it’s not really right.
Replication is central to science. Ellenberg comments:
But even studies that could be replicated often aren’t. Every journal wants to publish a breakthrough finding, but who wants to publish the paper that does the same experiment a year later and gets the same result? Even worse, what happens to papers that carry out the same experiment and don’t find a significant result? For the system to work, those experiments need to be made public. Too often they end up in the file drawer instead.
But the culture is changing. Reformers with loud voices like Ioannidis and Simonsohn, who speak both to the scientific community and to the broader public, have generated a new sense of urgency about the danger of descent into large-scale haruspicy. In 2013, the Association for Psychological Science announced that they would start publishing a new genre of article, called Registered Replication Reports. These reports, aimed at reproducing the effects reported in widely cited studies, are treated differently from usual papers in a crucial way: the proposed experiment is accepted for publication before the study is carried out.
TEN: ARE YOU THERE GOD? IT’S ME, BAYESIAN INFERENCE
While we can predict the course of an asteroid better as we get ever more data, there may be hard limits on how far into the future meteorologists can predict the weather. The weather is chaotic, and a sea gull flapping its wings could alter the weather forever. Ellenberg:
Is human behavior more like an asteroid or more like the weather? It surely depends on what aspect of human behavior you’re talking about. In at least one respect, human behavior ought to be even harder to predict than the weather. We have a very good mathematical model for weather, which allows us at least to get better at short-range predictions when given access to more data, even if the inherent chaos of the system inevitably wins out. For human action we have no such model and may never have one. That makes the prediction problem massively harder.
Ellenberg asks whether Facebook can predict that someone is a terrorist.
| on Facebook list | Not on list | |
| terrorist | 10 | 9,990 |
| not terrorist | 99,990 | 199,890,010 |
What if your neighbor ends up on the Facebook list? Ellenberg:
The null hypothesis is that your neighbor is not a terrorist. Under that hypothesis–that is, presuming his innocence–the chance of him showing up on the Facebook red list is a mere 0.05%, well below the 1-in-20 threshold of statistical significance. In other words, under the rules that govern the majority of contemporary science, you’d be justified in rejecting the null hypothesis and declaring your neighbor a terrorist.
Except there’s a 99.99% chance he’s not a terrorist.
Ellenberg continues:
On the one hand, there’s hardly any chance that an innocent person will be flagged by the algorithm. At the same time, the people the algorithm points to are almost all innocent. It seems like a paradox, but it’s not. It’s just how things are…
Here’s the crux. There are really two questions you can ask. They sound kind of the same, but they’re not.
Question 1: What’s the chance that a person gets put on Facebook’s list, given that they’re not a terrorist?
Question 2: What’s the chance that a person’s not a terrorist, given that they’re on Facebook’s list?
One way you can tell these two questions are different is that they have different answers. Really different answers. We’ve already seen that the answer to the first question is about 1 in 2,000, while the answer to the second is 99.99%. And it’s the answer to the second question that you really want.
Ellenberg:
The p-value is the answer to the question
“The chance that the observed experimental result would occur, given that the null hypothesis is correct.”
But what we want to know is the other conditional probability:
“The chance that the null hypothesis is correct, given that we observed a certain experimental result.”
Ellenberg adds:
The danger arises precisely when we confuse the second quantity for the first. And this confusion is everywhere, not just in scientific studies. When the district attorney leans into the jury box and announces, “There is only a one in five million, I repeat, a ONE IN FIVE MILLLLLLLION CHANCE that an INNOCENT MAN would match the DNA sample found at the scene,” he is answering question 1, How likely would an innocent person be to look guilty? But the jury’s job is to answer question 2, How likely is this guilty-looking defendant to be innocent?
In Bayesian inference, you start out with your best guess–the a priori probability that something is true–and then, once you get further evidence, you end up with a posterior probability. Consider the example of the neighbor being on Facebook’s terrorist list.
The neighbor’s presence on the list really does offer some evidence that he’s a potential terrorist. But your prior for that hypothesis ought to be very small, because most people aren’t terrorists. So, despite the evidence, your posterior probability remains small as well, and you don’t–or at least shouldn’t–worry.
Ellenberg writes:
For those who are willing to adopt the view of probability as degree of belief, Bayes’s theorem can be seen not as a mere mathematical equation but as a form of numerically flavored advice. It gives us a rule, which we may choose to follow or not, for how we should update our beliefs about things in the light of new observations. In this new, more general form, it is naturally the subject of much fiercer disputation. There are hard-core Bayesians who think that all our beliefs should be formed by strict Bayesian computations, or at least as strict as our limited cognition can make them; others think of Bayes’s rule as more of a loose qualitative guideline.
Here is Bayes’s rule:
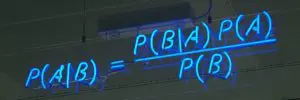
(Photo by mattbuck, via Wikimedia Commons)
Ellenberg quotes Sherlock Holmes:
“It is an old maxim of mine that when you have excluded the impossible, whatever remains, however improbable, must be the truth.”
Ellenberg says Holmes should have said the following:
“It is an old maxim of mine that when you have excluded the impossible, whatever remains, however improbable, must be the truth, unless the truth is a hypothesis it didn’t occur to you to consider.”
Ellenberg gives the example of GOD vs. NO GOD. There are other possibilities, like GODS (plural), which could help explain creation. Ellenberg:
…Another theory with some adherents is SIMS, where we’re not actually people at all, but simulations running on an ultracomputer built by other people. That sounds bizarre, but plenty of people take the idea seriously (most famously, the Oxford philosopher Nick Bostrom), and on Bayesian grounds, it’s hard to see why you shouldn’t. People like to build simulations of real-world events; surely, if the human race doesn’t extinguish itself, our power to simulate will only increase, and it doesn’t seem crazy to imagine that those simulations might one day include conscious entities that believe themselves to be people.
All that said, Ellenberg notes that it’s probably best to arrive at faith–or to discard it–in a non-quantitative way. And people should stick to, “I do believe in God,” or “I don’t believe in God,” or “I’m not sure.”
PART III: EXPECTATION
ELEVEN: WHAT TO EXPECT WHEN YOU’RE EXPECTING TO WIN THE LOTTERY
Ellenberg notes:
During the Revolutionary War, both the Continental Congress and the governments of the states established lotteries to fund the fight against the British. Harvard, back in the days before it enjoyed a nine-figure endowment, ran lotteries in 1794 and 1810 to fund two new college buildings.
Like “statistical significance,” the term “expected value” is misleading. If you bet $10 on a dog that has a 10% chance of winning, then the expected value is:
(10% x $100) + (90% x $0) = $10
The expected value for the $10 bet is $10. But that’s not what you expect. You expect either $0 or $100. Ellenberg states that “average value” might be a better term than “expected value.” If you make one thousand $10 bets–with each bet having a 10% chance of winning $100 and a 90% chance of winning $0–then you would expect to make about $10,000, which equals the total amount that you bet. Over time, if you keep repeating this bet, you expect to come out even.
What is your expected value from playing Powerball? Assuming the jackpot is $100 million, your expected value is:
100 million / 175 million + 1 million / 5 million + 10,000 / 650,000 + 100 / 19,000 + 100 / 12,000 + 7 / 700 + 7 / 360 + 4 / 110 + 4 / 55
All the different terms represent different amounts that you can win playing Powerball with the jackpot at $100 million. (These smaller prizes keep people feeling that the game is worth playing.) If you work out that math, your expected value from playing is just under 94 cents per $2 ticket. For each $2 ticket you buy, on average you expect to get back just under 94 cents. It would seem that the game is not worth playing, but what if the jackpot, call it J, is higher? Your expected value is:
J / 175 million + 1 million / 5 million + 10,000 / 650,000 + 100 / 19,000 + 100 / 12,000 + 7 / 700 + 7 / 360 + 4 / 110 + 4 / 55
This simplifies to:
J / 175 million + 36.7 cents
The breakeven threshold is a bit over J = $285 million. So if the jackpot is greater than $285 million, then you expect to win more than $2 for each $2 bet. It makes sense not only to play, but to buy as many $2 tickets as you can reasonably afford.
But this assumes that all the other players fail to win the jackpot. Assume there are 75 million players total. Assume you win and that the jackpot is $337 million. What are the odds that everyone else loses? It is (174,999,999 / 175,000,000) multiplied by itself 75 million times, which is 0.651… (65.1%). This means there’s about a 35% chance that someone else will win, which means you would have to share the jackpot. Your expected payoff is:
65% x $337 million + 35% x $168 million = $278 million
$278 million is below the $285 million threshold, so the possibility of sharing the jackpot means that the game is no longer worth playing (assuming a $337 million jackpot and 75 million players).
Are lotteries always bad bets? No. Consider the story of Cash WinFall in Massachusetts. Here’s the prize distribution on a normal day:
| match all 6 numbers | 1 in 9.3 million | variable jackpot |
| match 5 of 6 | 1 in 39,000 | $4,000 |
| match 4 of 6 | 1 in 800 | $150 |
| match 3 of 6 | 1 in 47 | $5 |
| match 2 of 6 | 1 in 6.8 | free lottery ticket |
Assume the jackpot is $1 million. Then the expected return on a $2 ticket is:
($1 million / 9.3 million) + ($4,000 / 39,000) + ($150 / 800) + ($5 / 47) + ($2 / 6.8) = 79.8 cents
Each $2 bet would return about 80 cents, which is not a good bet. However, roll-down days are different. (Roll-downs happen when nobody wins the jackpot, so the prize money is rolled down.) On February 7, 2005, nobody won the $3 million dollar jackpot. So the money was rolled down:
The state’s formula rolled $600,000 to the match-5 and match-3 prize pools and $1.4 million into the match-4s. The probability of getting 4 out of 6 WinFall numbers right is about 1 in 800, so there must have been about 600 match-4 winners that day out of the 470,000 players. That’s a lot of winners, but $1.4 million dollars is a lot of money… In fact, you’d expect the payout for matching 4 out of 6 numbers that day to be around $2,385. That’s a much more attractive proposition than the measly $150 you’d win on a normal day. A 1-in-800 chance of a $2,385 payoff has an expected value of
$2385 / 800 = $2.98
The match-4 prize alone makes the game profitable. If you add in the other payoffs, the ticket is worth
$50,000 / 39,000 + $2385 / 800 + $60 / 47 = $5.53
So for each $2 you invest, you expect to get back $5.53 on average. To be clear: If you only bought one ticket, you probably wouldn’t win even though the average payoff is positive. However, if you bought one thousand tickets, or ten thousand, then you would almost certainly earn a profitable return of about $5.53 per $2 ticket purchased.
February 7, 2005, is when James Harvey, an MIT senior doing an independent study on the merits of various state lottery games, realized that Massachusetts had accidentally created a highly profitable investment opportunity. Harvey got a group of MIT friends together, and they purchased a thousand tickets. Overall, they tripled their investment. Ellenberg:
It won’t surprise you to hear that Harvey and his co-investors didn’t stop playing Cash WinFall. Or that he never did get around to finishing that independent study–at least not for course credit. In fact, his research project quickly developed into a thriving business. By summer, Harvey’s confederates were buying tens of thousands of tickets at a time… They called their team Random Strategies, though their approach was anything but scattershot; the name referred to Random Hall, the MIT dorm where Harvey had originally cooked up his plan to make money on WinFall.
And the MIT students weren’t alone. At least two more betting clubs formed up to take advantage of the WinFall windfall. Ying Zhang, a medical researcher in Boston with a PhD from Northeastern, formed the Doctor Zhang Lottery Club… Before long, the group was buying $300,000 worth of tickets for each roll-down. In 2006, Doctor Zhang quit doctoring to devote himself full-time to Cash WinFall.
Still another betting group was led by Gerald Selbee, a retiree in his seventies with a bachelor’s degree in math.
TWELVE: MISS MORE PLANES!
Assume that if you arrive at the airport 2 hours early, you have a 2% chance of missing the plane; if you arrive 1.5 hours early, you have a 5% chance of missing the plane; and if you arrive 1 hour early, you have a 15% chance of missing the plane. Then, if you think of missing a plane as costing six hours of time, you can calculate the expected cost in utils of arriving at the airport 2 hours, 1.5 hours, and 1 hour early.
| Option 1 | –2 + 2% x (–6) = –2.12 utils |
| Option 2 | –1.5 + 5% x (–6) = –1.8 utils |
| Option 3 | –1 + 15% x (–6) = –1.9 utils |
Under these assumptions, you should arrive at the airport 1.5 hours early. Of course, maybe you really hate missing a plane. Perhaps the cost of missing a plane is –20 utils. In that case, if you redo the expected value, then Option 1 works out to be your best choice.
Ellenberg discusses Pascal’s wager. Say that living a life of piety costs 100 utils. But if the God of Christianity is real, and if you believe it and live accordingly, then the payoff is infinite joy. Say there’s a 5% chance that the God of Christianity is real. Then Pascal’s wager can be written:
(5%) x infinity + (95%) x (–100) = infinity
No matter how small the odds of the Christian God’s existence, a tiny number times infinity is still infinity. Ellenberg comments:
Pascal’s argument has serious flaws. The gravest is that it suffers from… failing to consider all possible hypotheses. In Pascal’s setup, there are only two options: that the God of Christianity is real and will reward that particular sector of the faithful, or that God doesn’t exist. But what if there’s a God who damns Christians eternally? Such a God is surely possible too, and this possibility alone suffices to kill the argument…
Utils can be useful for problems that don’t have well-defined dollar values. But they can also be useful for problems that are stated in dollar values. In 1738, Daniel Bernoulli put forward the St. Petersburg Paradox: “Peter tosses a coin and continues to do so until it should land ‘heads’ when it comes to the ground. He agrees to give Paul one ducat if he gets ‘heads’ on the very first throw, two ducats if he gets it on the second, four if on the third, eight if on the fourth, and so on, so that with each additional throw the number of ducats he must pay is doubled.” The question is: How much should Paul pay in order to play this game? Paul’s expected return is:
(1/2) x 1 + (1/4) x 2 + (1/8) x 4 + (1/16) x 8 + (1/32) x 16 + …
This can be written as:
(1/2) + (1/2) + (1/2) + (1/2) + (1/2) + …
It would seem that the expected dollar value of playing the game is infinite, so Paul should be willing to spend any number of ducats in order to play. Ellenberg:
The mistake, Bernoulli said, is to say that a ducat is a ducat is a ducat… having two thousand ducats isn’t twice as good as having one thousand; it is less than twice as good, because a thousand ducats is worth less to a person who already has a thousand ducats than it is to the person who has none…
Bernoulli thought that utility grew like the logarithm, so that the kth prize of 2k ducats was worth just k utils…
In Bernoulli’s formulation, the expected utility of the St. Petersburg game is the sum
(1/2) x 1 + (1/4) x 2 + (1/8) x 3 + (1/16) x 4 + ….
This series equals 2. To see this, consider:
(1/2) + (1/4) + (1/8) + (1/16) + (1/32) + … = 1
(1/4) + (1/8) + (1/16) + (1/32) + … = 1/2
(1/8) + (1/16) + (1/32) + … = 1/4
(1/16) + (1/32) + … = 1/8
(1/32) + … = 1/16
The top row is Zeno’s paradox. The series converges to 1. The second row is just the top row, but without the 1/2 at the beginning, so it must equal 1/2. The third row is the same as the second, but without the 1/4 at the beginning, so it must equal 1/4. And so forth. If you look at the series of what each row equals, you get:
1 + (1/2) + (1/4) + (1/8) + (1/16) + (1/32) + … = 2
If you sum up the columns of the five rows above, you get:
1/2 + 2/4 + 3/8 + 4/16 + 5/32 + … = 2
This series converges to 2. So the expected utility of the St. Petersburg game is 2. Paul should be willing to pay 2 ducats in order to play this game. 2 is substantially less than infinity.
THIRTEEN: WHERE THE TRAIN TRACKS MEET
Ellenberg writes:
Mathematical elegance and practical utility are close companions, as the history of science has shown again and again. Sometimes scientists discover the theory and leave it to mathematicians to figure out why it’s elegant, and other times mathematicians develop an elegant theory and leave it to scientists to figure out what it’s good for.
Ellenberg introduces the projective plane, which is governed by two axioms:
-
- Every pair of points is contained in exactly one common line.
- Every pair of lines contains exactly one common point.
If you trace out two parallel lines traveling away from you, those two lines meet on the horizon. Call that point P. But that vanishing point is defined to be the same point P if you turned around and looked the opposite direction. In this way, if you think about a graph, the y-axis is a circle going vertically, while the x-axis is a circle going horizontally.
Are there other geometries besides the projective plane that satisfy the two axioms? Yes. For example, the Fano plane:
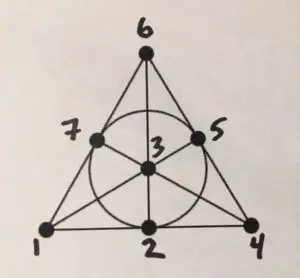
Ellenberg comments:
For Fano and his intellectual heirs, it doesn’t matter whether a line “looks like” a line, a circle, a mallard duck, or anything else–all that matters is that lines obey the laws of lines, set down by Euclid and his successors. If it walks like geometry, and it quacks like geometry, we call it geometry. To one way of thinking, this move constitutes a rupture between mathematics and reality, and is to be resisted. But that view is too conservative. The bold idea that we can think geometrically about systems that don’t look like Euclidean space, and even call these systems “geometries” with head held high, turned out to be critical to understanding the geometry of relativistic space-time we live in; and nowadays we use generalized geometric ideas to map Internet landscapes, which are even further removed from anything Euclid would recognize. That’s part of the glory of math; we develop a body of ideas, and once they’re correct, they’re correct, even when applied far, far outside the context in which they were first conceived.
Looking at Fano’s plane again, there are seven lines (one of which is the circle), each of which has three points on it.
-
- 124
- 135
- 167
- 257
- 347
- 236
- 456
Look familiar? Ellenberg:
This is none other than the seven-ticket combo we saw in the last section, the one that hits each pair of numbers exactly once, guaranteeing a minimum payoff…
…it’s simply geometry. Each pair of numbers appears on exactly one ticket, because each pair of points appears on exactly one line. It’s just Euclid, even though we’re speaking now of points and lines Euclid would not have recognized as such.
What about the Massachusetts lottery? There is no geometry that fits the precise requirements. Ellenberg says we should consider the theory of digital signal processing. Say we’re trying to send the following digital message:
1110101…
Assume this is a communication to a satellite that says, “Turn on right thruster.” But what if the message get garbled and sends the following instead:
1010101…
This could mean, “Turn on the left thruster.” That would be a serious problem. A solution is to send each digit twice. So the original message looks like:
11 11 11 00 11 00 11…
However, this still doesn’t solve the issue of potential garbling because if 11 gets turned into 01, we don’t know if 01 is supposed to be 11 or 00. This can be solved by repeating each digit three times. So the message looks like:
111 111 111 000 111 000 111…
Now if 111 gets garbled and turns into 101, the satellite knows it’s supposed to be 111. That’s not a guarantee, of course, but there’s at least a high probability that the original message was 111. Ellenberg asks whether there can really be a mathematical theory of communication. Ellenberg comments:
Understand this: I warmly endorse, in fact highly recommend, a bristly skepticism in the face of all claims that such-and-such an entity can be explained, or tamed, or fully understood, by mathematical means.
And yet the history of mathematics is a history of aggressive territorial expansion, as mathematical techniques get broader and richer, and mathematicians find ways to address questions previously thought of as outside their domain. “A mathematical theory of probability” sounds unexceptional now, but once it would have seemed a massive overreach; math was about the certain and the true, not the random and the maybe-so! All that changed when Pascal, Bernoulli, and others found mathematical laws that governed the workings of chance. A mathematical theory of infinity? Before the work of Georg Cantor in the nineteenth century, the study of the infinite was as much theology as science; now we understand Cantor’s theory of multiple infinities, each one infinitely larger than the last, well enough to teach it to first-year math majors.
These mathematical formalisms don’t capture every detail of the phenomena they describe, and aren’t intended to. There are questions about randomness, for instance, about which probability theory is silent…
People are working on mathematical theories that can explain and describe consciousness, society, aesthetics, and other areas. Though success has thus far been limited, mathematics may end up getting some important points right, notes Ellenberg.
Regarding information theory, a colleague of Claude Shannon, Richard Hamming, was trying to run his programs on the weekend, but any error would halt the computation, with no one to get the machine running again until Monday morning. So Hamming thought of a way for the machine to correct its own errors. First he broke the message into blocks of three symbols. Then he invented a way for each three-digit block to be transformed into a seven-digit string. This is the Hamming code:
-
- 000 -> 0000000
- 001 -> 0010111
- 010 -> 0101011
- 011 -> 0111100
- 101 -> 1011010
- 110 -> 1100110
- 100 -> 1001101
- 111 -> 1110001
If the receiver gets anything that isn’t a code word, something has gone wrong. Also, if a message is only different from a code word by one digit, you can safely infer which code word was intended.
Look back at the lines in the Fano plane.
…the seven nonzero code words in the Hamming code match up exactly to the seven lines in the Fano plane [124 is 0010111, for instance, while 135 is 0101011]. The Hamming code and the Fano plane… are exactly the same mathematical object in two different outfits!
Note that the Hamming code sends just seven bits for every three bits of your original message, a more efficient ratio of 2.33 (vs. 3 for the repeat-three-times code presented earlier). There’s also the idea of Hamming distance, which is the number of bits you need to alter to go from one code word to another. Two different code words are at a Hamming distance of at least 4 from each other.
Ellenberg continues:
Hamming’s notion of “distance” follows Fano’s philosophy… But why stop there? The set of points at distance less than or equal to 1 from a given central point… is called a circle, or, if we are in higher dimensions, a sphere. So we’re compelled to call the set of strings at Hamming distance at most 1 from a code word a “Hamming sphere,” with the code word at the center. For a code to be an error-correcting code, no string–no point, if we’re to take this geometric analogy seriously–can be within distance 1 of two different code words; in other words, we ask that no two of the Hamming spheres centered at the code words share any points.
So the problem of constructing error-correcting codes has the same structure as a classical geometric problem, that of sphere packing: how do we fit a bunch of equal-sized spheres as tightly as possible into a small space, in such a way that no two spheres overlap? More succinctly, how many oranges can you stuff into a box?
If playing the lottery is fun, then it’s OK to spend a few dollars regularly playing. Also, you won’t end up in a lower class by playing, but if you get lucky and win, you could end up in a higher class. The bottom line, as Ellenberg says, is that mathematics gives you permission to go ahead and play Powerball if it’s fun for you.
Ellenberg concludes by comparing an entrepreneur to someone who plays the lottery:
…That’s the nature of entrepreneurship: you balance a very, very small probability of making a fortune against a modest probability of eking out a living against a substantially larger probability of losing your pile, and for a large proportion of potential entrepreneurs, when you crunch the numbers, the expected financial value, like that of a lottery ticket, is less than zero… And yet society benefits from a world in which people, against their wiser judgment, launch businesses.
Perhaps the biggest part of the utility of running a business, notes Ellenberg, is the act of realizing a dream, or even trying to realize it.
PART IV: REGRESSION
FOURTEEN: THE TRIUMPH OF MEDIOCRITY
Horace Secrist was a professor of statistics and director of the Bureau for Business Research at Northwestern. Since 1920 and into the great crash, Secrist had been tracking a number of statistics on various businesses. What he found was reversion to the mean, i.e., regression to mediocrity:
Secrist found the same phenomenon in every kind of business. Hardware stores regressed to mediocrity; so did grocery stores. And it didn’t matter what metric you used. Secrist tried measuring his companies by the ratio of wages to sales, the ratio of rent to sales, and whatever other economic stat he could put his hands on. It didn’t matter. With time, the top performers started to look and behave just like the members of the common mass.
Similarly, Secrist found that the bottom performers improved and became more like the average. Secrist’s views descend from those of the nineteenth-century British scientist, Francis Galton.
Galton had a peripatetic education; he tried studying mathematics at Cambridge but was defeated by the brutal Tripos exam, and devoted himself intermittently to the study of medicine, the line of work his parents had planned for him. But after his father died in 1844, leaving him a substantial fortune, he found himself suddenly less motivated to pursue a traditional career. For a while Galton was an explorer, leading expeditions into the African interior. But the epochal publication of The Origin of Species in 1859 catalyzed a drastic shift in his interests: …from then on, the greater share of Galton’s work was devoted to the heredity of human characteristics, both physical and mental.
(Sir Francis Galton in the 1850s or early 1860s, scanned from Karl Pearson’s biography, via Wikimedia Commons)
Galton discovered regression to the mean. For example, tall parents were likely to have tall children, but those children were usually not as tall as the parents. Similarly, short parents were likely to have short children, but those children were usually not as share as the parents. In both cases, there is regression to the mean. Ellenberg:
So, too, Galton reasoned, must it be for mental achievement. And this conforms with common experience; the children of a great composer, or scientist, or political leader, often excel in the same field, but seldom so much so as their illustrious parent. Galton was observing the same phenomenon that Secrist would uncover in the operations of business. Excellence doesn’t persist; time passes, and mediocrity asserts itself.
People are tall due to a combination of genetics and chance. Genetics persist, but chance does not persist. That’s why the children of tall parents tend to be tall, but not as tall as their parents: the factor of chance does not persist. Ellenberg explains:
It’s just the same for businesses. Secrist wasn’t wrong about the firms that had the fattest profits in 1922; it’s likely that they ranked among the most well-managed companies in their sectors. But they were lucky, too. As time went by, their management might well have remained superior in wisdom and judgment. But the companies that were lucky in 1922 were no more likely than any other companies to be lucky ten years later.
FIFTEEN: GALTON’S ELLIPSE
A scatterplot of the heights of fathers versus the heights of sons arranges itself in an elliptical pattern, where the heights of sons are closer to the mean than the heights of fathers. Ellenberg:
…we have ellipses of various levels of skinniness. That skinniness, which the classical geometers call the eccentricity of the ellipse, is a measure of the extent to which the height of the father determines that of the son. High eccentricity means that heredity is powerful and regression to the mean is weak; low eccentricity means the opposite, that regression to the mean holds sway. Galton called his measure correlation, the term we still use today. If Galton’s ellipse is almost round, the correlation is near 0; when the ellipse is skinny, lined up along the northeast-southwest axis, the correlation comes close to 1.
It’s important to note that correlation is not transitive. A may be correlated with B, and B with C, but that doesn’t mean A is correlated with C. Ellenberg:
If correlation were transitive, medical research would be a lot easier than it actually is. Decades of observation and data collection have given us lots of known correlations to work with. If we had transitivity, doctors could just chain these together into reliable interventions. We know that women’s estrogen levels are correlated with lower risk of heart disease, and we know that hormone replacement therapy can raise those levels, so you might expect hormone replacement therapy to be protective against heart disease. And, indeed, that used to be conventional clinical wisdom. But the truth, as you’ve probably heard, is a lot more complicated. In the early 2000s, the Women’s Health Initiative, a long-term study involving a gigantic randomized clinical trial, reported that hormone replacement therapy with estrogen and progestin appeared actually to increase the risk of heart disease in the population they studied…
In the real world, it’s next to impossible to predict what effect a drug will have on a disease, even if you know a lot about how it affects biomarkers like HDL or estrogen level. The human body is an immensely complex system, and there are only a few of its features we can measure, let alone manipulate. But on the correlations we can observe, there are lots of drugs that might plausibly have a desired health effect. And so you try them out in experiments, and most of them fail dismally. To work in drug development requires a resilient psyche, not to mention a vast pool of capital.
SIXTEEN: DOES LUNG CANCER MAKE YOU SMOKE CIGARETTES?
Correlation is not causation:
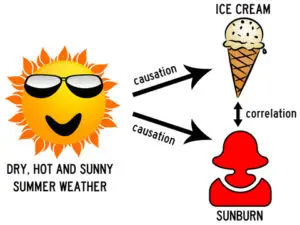
(Photo by Alain Lacroix)
Ellenberg writes:
Teasing apart correlations that come from causal relationships from those that don’t is a maddeningly hard problem, even in cases you might think of as obvious, like the relation between smoking and lung cancer. At the turn of the twentieth century, lung cancer was an extremely rare disease. But by 1947, the disease accounted for nearly a fifth of cancer deaths among British men, killing fifteen times as many people as it had a few decades earlier. At first, many researchers thought that lung cancer was simply being diagnosed more effectively than before, but it soon became clear that the increase in cases was too big and too fast to be accounted for by any such effect. Lung cancer really was on the rise. But no one was sure what to blame. Maybe it was smoke from factories, maybe increased levels of car exhaust, or maybe some substance not even thought of as a pollutant. Or maybe it was cigarette smoking, whose popularity had exploded during the same period.
In the 1950s, there were some large studies that showed a correlation between smoking and lung cancer. That doesn’t establish causality. Perhaps lung cancer causes smoking, or perhaps there is a common cause that leads to both smoking and lung cancer. It’s not very reasonable to assert that lung cancer causes smoking, because the tumor would have to reach back years into the past to start causing smoking. But it is possible that there is some cause responsible for both smoking and lung cancer. Keep in mind, notes Ellenberg, that in the 1950s, no chemical component of tobacco had yet been shown to produce tumors in the lab. Today, things are different. We know that smoking does cause lung cancer:
We know a lot more now about cancer and how tobacco brings it about. That smoking gives you cancer is no longer in serious dispute.
Back in the 1950s, the evidence was not so clear. But this seemed to change in the 1960s. Ellenberg:
By 1964, the association between smoking and cancer had appeared consistently across study after study. Heavier smokers suffered more cancer than lighter smokers, and cancer was most likely at the point of contact between tobacco and human tissue; cigarette smokers got more lung cancer, pipe smokers more lip cancer. Ex-smokers were less prone to cancer than smokers who kept up the habit. All these factors combined to lead the surgeon general’s committee to the conclusion that smoking was not just correlated with lung cancer, but caused lung cancer, and that efforts to reduce tobacco consumption would be likely to lengthen American lives.
From a public policy point of view, whether to come out against smoking depends on the expected value of doing so:
…So we don’t and can’t know the exact expected value of launching a campaign against…tobacco. But often we can say with confidence that the expected value is positive. Again, that doesn’t mean the campaign is sure to have good effects, only that the sum total of all similar campaigns, over time, is likely to do more good than harm. The very nature of uncertainty is that we don’t know which of our choices will help, like attacking tobacco, and which will hurt, like recommending hormone replacement therapy. But one thing’s for certain: refraining from making recommendations at all, on the grounds that they might be wrong, is a losing strategy. It’s a lot like George Stigler’s advice about missing planes. If you never give advice until you’re sure it’s right, you’re not giving enough advice.
PART V: EXISTENCE
SEVENTEEN: THERE IS NO SUCH THING AS PUBLIC OPINION
Americans report that they would rather cut government programs–and make government smaller–than pay more taxes. Ellenberg:
But which government programs? That’s where things get sticky. It turns out the things the U.S. government spends money on are things people kind of like. A Pew Research poll from February 2011 asked Americans about thirteen categories of government spending: in eleven of those categories, deficit or no deficit, more people wanted to increase spending than dial it down. Only foreign aid and unemployment insurance–which, combined, accounted for under 5% of 2010 spending–got the ax. That, too, agrees with years of data; the average American is always eager to slash foreign aid, occasionally tolerant of cuts of welfare or defense, and pretty gung ho for increased spending on every single other program our taxes fund.
Oh, yeah, and we want small government.

(Photo by David Watmough)
Ellenberg again:
The average American thinks there are plenty of non-worthwhile federal programs that are wasting our money and is ready and willing to put them on the chopping block to make ends meet. The problem is, there’s no consensus on which programs are the worthless ones. In large part, that’s because most Americans think the programs that benefit them personally are the ones that must, at all costs, be preserved…
Ellenberg continues:
The “majority rules” system is simple and elegant and feels fair, but it’s at its best when deciding between just two options. Any more than two, and contradictions start to seep into the majority’s preferences. As I write this, Americans are sharply divided over President Obama’s signature domestic policy accomplishment, the Affordable Care Act. In an October 2010 poll of likely voters, 52% of respondents said they opposed the law, while only 41% supported it. Bad news for Obama? Not once you break down the numbers. Outright repeal of health care reform was favored by 37%, with another 10% saying the law should be weakened; but 15% preferred to leave it as is, and 36% said the ACA should be expanded to change the current health care system more than it currently does. That suggests that many of the law’s opponents are to Obama’s left, not his right. There are (at least) three choices here: leave the health care law alone, kill it, or make it stronger. And each of the three choices is opposed by most Americans.
Ellenberg adds:
The incoherence of the majority creates plentiful opportunities to mislead. Here’s how Fox News might report the poll results above:
Majority of Americans oppose Obamacare!
And this is how it might look to MSNBC:
Majority of Americans want to preserve or strengthen Obamacare!
These two headlines tell very different stories about public opinion. Annoyingly enough, both are true.
But both are incomplete. The poll watcher who aspires not to be wrong has to test each of the poll’s options, to see whether it might break down into different-colored pieces. Fifty-six percent of the population disapproves of President Obama’s policy in the Middle East? That impressive figure might include people from both the no-blood-for-oil left and the nuke-’em-all right, with a few Pat Buchananists and devoted libertarians in the mix. By itself, it tells us just about nothing about what the people really want.
Ellenberg later writes about experiments studying the decision making of slime mold. Note that slime mold likes to eat oats and likes to avoid light. (Note also that you can train a slime mold to navigate through a maze by using oats.) In one experiment, the slime mold is faced with a choice: 3 grams of oats in the dark (3-dark) versus 5 grams of oats in the light (5-light). In this scenario, the slime mold picks 3-dark half the time and 5-light half the time.
Now, if you replace the 5 grams of oats with 10 grams (10-light), the slime mold chooses 10-light every time.
However, something strange happens if you have 3-dark and 5-light options, but then add a third option: 1-dark (1 gram of oats in the dark). You might think that the slime mold would never pick 1-dark. That’s true. But you might also think that the slime mold continues to pick 3-dark half the time and 5-light half the time. But that’s not what the slime mold does. Faced with 1-dark, 3-dark, and 5-light, the slime mold picks 3-dark more than three times as often as 5-light. Ellenberg:
The mathematical buzzword in play here is “independence of irrelevant alternatives.” That’s a rule that says, whether you’re a slime mold, a human being, or a democratic nation, if you have a choice between two options, A and B, the presence of a third option, C, shouldn’t affect which of A and B you like better.
Ellenberg gives an example. In Florida in the 2000 election, the majority preferred Gore over Bush. However, the presence of an irrelevant alternative–Ralph Nader–tipped the election to Bush. Bush got 48.85% of the vote, Gore got 48.84%, while Nader got 1.6%. Back to the slime mold:
…the slime mold likes the small, unlit pile of oats about as much as it likes the big, brightly lit one. But if you introduce a really small unlit pile of oats, the small dark pile looks better by comparison; so much so that the slime mold decides to choose it over the big bright pile almost all the time.
This phenomenon is called the “asymmetric domination effect,” and slime molds are not the only creatures subject to it. Biologists have found jays, honeybees, and hummingbirds acting in the same seemingly irrational way.
Not to mention humans!
Ellenberg tries to explain human irrationality:
Maybe individual people seem irrational because they aren’t really individuals! Each one of us is a little nation-state, doing our best to settle disputes and broker compromises between the squabbling voices that drive us. The results don’t always make sense. But they somehow allow us, like the slime molds, to shamble along without making too many terrible mistakes. Democracy is a mess–but it kind of works.
EIGHTEEN: “OUT OF NOTHING I HAVE CREATED A STRANGE NEW UNIVERSE”
Ellenberg poses an interesting question:
Are we trying to figure out what’s true, or are we trying to figure out what conclusions are licensed by our rules and procedures? Hopefully the two notions frequently agree; but all the difficulty, and all the conceptually interesting stuff, happens at the points where they diverge.
You might think it’s obvious that figuring out what’s true is always our proper business. But that’s not always the case in criminal law, where the difference presents itself quite starkly in the form of defendants who committed the crime but who cannot be convicted (say, because evidence was obtained improperly) or who are innocent of the crime but are convicted anyway. What’s justice here–to punish the guilty and free the innocent, or to follow criminal procedure wherever it leads us? In experimental science, we’ve already seen the dispute with R.A. Fisher on one side and Jerzy Neyman and Egon Pearson on the other. Are we, as Fisher thought, trying to figure out which hypotheses we should actually believe are true? Or are we to follow the Neyman-Pearson philosophy, under which we resist thinking about the truth of hypotheses at all and merely ask: Which hypotheses are we to certify as correct, whether they’re really true or not, according to our chosen rules of inference?
You might think that mathematics itself doesn’t have such problems. But it does. Consider the parallel postulate, Euclid’s fifth axiom: “If P is a point and L is a line not passing through P, there is exactly one line through P parallel to L.” Even Euclid was thought to dislike his fifth axiom. He proved the first twenty-eight propositions in the Elements using only the first four axioms.
In 1820, the Hungarian noble Farkas Bolyai, who had given years of his life to the problem, wrote a letter to his son trying to dissuade him from attempting to solve the same problem. However, Janos Bolyai ignored his father’s advice. By 1823, he had an outline of the solution. He wrote to his father, “out of nothing I have created a strange new universe.”
Jonas Bolyai inverted the problem and asked: If the parallel axiom were false, would a contradiction follow? Bolyai realized the answer was no:
…there was another geometry, not Euclid’s but something else, in which the first four axioms were correct but the parallel postulate was not. Thus, there can be no proof of the parallel postulate from the other axioms; such a proof would rule out the possibility of Bolyai’s geometry. But there it was.
Sometimes, a mathematical development is “in the air”–for reasons only poorly understood, the community is ready for a certain advance to come, and it comes from several sources at once. Just as Bolyai was constructing his non-Euclidean geometry in Austria-Hungary, Nikolai Lobachevskii was doing the same in Russia. And the great Carl Friedrich Gauss, an old friend of the senior Bolyai, had formulated many of the same ideas in work that had not yet seen print…
A few decades later, Bernhard Riemann pointed out that there’s a simpler non-Euclidean geometry: the geometry of the sphere. Consider Euclid’s first four axioms:
-
- There is a Line joining any two Points.
- Any Line segment can be extended to a Line segment of any desired length.
- For every Line segment L, there is a Circle which has L as a radius.
- All Right Angles are congruent to each other.
Ellenberg on Riemann’s spherical geometry:
A Point is a pair of points on the sphere which are antipodal, or diametrically opposite each other. A Line is a “great circle”–that is, a circle on the sphere’s surface–and a Line segment is a segment of such a circle. A Circle is a circle, now allowed to be of any size.
Using these definitions, Euclid’s first four axioms are true. Ellenberg comments:
Here’s the thing; once you understand that the first four axioms apply to many different geometries, then any theorem Euclid proves from only those axioms must be true, not only in Euclid’s geometry, but in all the geometries where those axioms hold. It’s a kind of mathematical force multiplier; from one proof, you get many theorems.
And these theorems are not just about abstract geometries made up to prove a point. Post-Einstein, we understand that non-Euclidean geometry is not just a game; like it or not, it’s the way space-time actually looks.
This is a story told in mathematics again and again: we develop a method that works for one problem, and if it is a good method, one that really contains a new idea, we typically find that the same proof works in many different contexts, which may be as different from the original as a sphere is from a plane, or more so.
Ellenberg continues:
The tradition is called “formalism.” It’s what G. H. Hardy was talking about when he remarked, admiringly, that mathematicians of the nineteenth century finally began to ask what things like
1 – 1 + 1 – 1 + …
should be defined to be, rather than what they were… In the purest version of this view, mathematics becomes a kind of game played with symbols and words. A statement is a theorem precisely if it follows by logical steps from the axioms. But what the axioms and theorems refer to, what they mean, is up for grabs. What is a Point, or a Line…? It can be anything that behaves the way the axioms demand, and the meaning we should choose is whichever one suits our present needs. A purely formal geometry is a geometry you can in principle do without ever having seen or imagined a point or a line; it is a geometry in which it’s irrelevant what points and lines, understood in the usual way, are actually like.
Mathematical formalism shares similarities with legal formalism.
In Scalia’s view, when judges try to understand what the law intends–its spirit–they’re inevitably bamboozled by their own prejudices and desires. Better to stick to the words of the Constitution and the statutes, treating them as axioms from which judgments can be derived by something like logical deduction.
Ellenberg continues:
Formalism has an austere elegance. It appeals to people like G. H. Hardy, Antonin Scalia, and me, who relish that feeling of a nice rigid theory shut tight against contradiction. But it’s not easy to hold to principles like this consistently, and it’s not clear it’s even wise. Even Justice Scalia has occasionally conceded that when the literal words of the law seem to require an absurd judgment, the literal words have to be set aside in favor of a reasonable guess as to what Congress must have meant. In just the same way, no scientist really wants to be bound strictly by the rules of significance, no matter what they say their principles are. When you run two experiments, one testing a clinical treatment that seems theoretically promising and the other testing whether dead salmon respond emotionally to romantic photos, and both experiments succeed with p-values of .03, you don’t really want to treat the two hypotheses the same.
Ellenberg then notes that the German mathematician David Hilbert was formalism’s greatest champion in mathematics.
(David Hilbert before 1912, via Wikimedia Commons)
Hilbert wanted to create a purely formal mathematics. To say that a statement was true was to say that it could be derived logically from the axioms. However, says Ellenberg:
Mathematics has a nasty habit of showing that, sometimes, what’s obviously true is absolutely wrong.
For an example, consider set theory. An ouroboric set has itself as a member.
Let NO be the set of all non-ouroboric sets…
Is NO ouroboric or not? That is, is NO an element of NO? By definition, if NO is ouroboric, then NO cannot be in NO, which consists only of non-ouroboric sets. But to say NO is not an element of NO is precisely to say NO is non-ouroboric; it does not contain itself.
But wait a minute–if NO is non-ouroboric, then it is an element of NO, which is the set of all non-ouroboric sets. Now NO is an element of NO after all, which is to say that NO is ouroboric.
If NO is ouroboric, it isn’t, and if it isn’t, it is.
But could finite arithmetic be proved consistent? Ellenberg:
Hilbert sought a finitary proof of consistency, one that did not make reference to any infinite sets, one that a rational mind couldn’t help but wholly believe.
But Hilbert was to be disappointed. In 1931, Kurt Godel proved in his famous second incompleteness theorem that there could be no finite proof of the consistency of arithmetic. He had killed Hilbert’s program with a single stroke.
Nonetheless:
Hilbert’s style of mathematics survived the death of his formalist program.
HOW TO BE RIGHT
Nearly everyone has heard of Theodore Roosevelt’s speech “Citizenship in a Republic,” which he delivered in Paris in 1910. Here’s the part people love to quote:
It is not the critic who counts; not the man who points out how the strong man stumbles, or where the doer of deeds could have done them better. The credit belongs to the man who is actually in the arena, whose faced is marred by dust and sweat and blood; who strives valiantly; who errs, who comes short again and again, because there is no effort without error and shortcoming; but who does actually strive to do the deeds; who knows great enthusiasms, the great devotions; who spends himself in a worthy cause; who at the best knows in the end the triumph of high achievement, and who at the worst, if he fails, at least fails while daring greatly, so that his place shall never be with those cold and timid souls who neither know victory nor defeat.
Ellenberg writes:
And yet, when Roosevelt says, “The closet philosopher, the refined and cultured individual who from his library tells how men ought to be governed under ideal conditions, is of no use in actual governmental work,” I think of Condorcet, who spent his time in the library doing just that, and who contributed more to the French state than most of his time’s more practical men. And when Roosevelt sneers at the cold and timid souls who sit on the sidelines and second-guess the warriors, I come back to Abraham Wald, who as far as I know went his whole life without lifting a weapon in anger, but who nonetheless played a serious part in the American war effort, precisely by counseling the doers of deeds how to do them better. He was unsweaty, undusty, and unbloody, but he was right. He was a critic who counted.
Mathematics not only deals with certainties, but also allows us to deal with uncertainty. Ellenberg:
Math gives us a way of being unsure in a principled way: not just throwing up our hands and saying “huh,” but rather making a firm assertion: “I’m not sure, this is why I’m not sure, and this is roughly how not-sure I am.” Or even more: “I’m unsure, and you should be too.”
Ellenberg comments:
The paladin of principled uncertainty in our time is Nate Silver, the online-poker-player-turned-baseball-statistics-maven-turned-political analyst…
What made Silver so good? In large part, it’s that he was willing to talk about uncertainty, willing to treat uncertainty not as a sign of weakness but as a real thing in the world, a thing that can be studied with scientific rigor and employed to good effect. If it’s September 2012 and you ask a bunch of political pundits, “Who’s going to be elected president in November?” a bunch of them are going to say, “Obama is,” and a somewhat smaller bunch are going to say, “Romney is,” and the point is that all of those people are wrong, because the right answer is the kind of answer that Silver, almost alone in the broad-reach media, was willing to give: “Either one might win, but Obama is substantially more likely to win.”
One important piece of advice for mathematicians who are trying to prove a theorem is to divide your time between trying to prove the theorem and trying to disprove it. First, the theorem could be wrong, in which case the sooner you realize that, the better. Second, if the theorem is true and you try to disprove it, eventually you will get a better idea of how to prove that the theorem is true.
This self-critical attitude applies to other areas besides mathematics, says Ellenberg:
Proving by day and disproving by might is not just for mathematics. I find it’s a good habit to put pressure on all your beliefs, social, political, scientific, and philosophical. Believe whatever you believe by day; but at night, argue against the propositions you hold most dear. Don’t cheat! To the greatest extent possible you have to think as though you believe what you don’t believe. And if you can’t talk yourself out of your existing beliefs, you’ll know a lot more about why you believe what you believe. You’ll have come a little closer to a proof.
Ellenberg concludes:
What’s true is that the sensation of mathematical understanding–of suddenly knowing what’s going on, with total certainty, all the way to the bottom–is a special thing, attainable in few if any other places in life. You feel you’ve reached in to the universe’s guts and put your hand on the wire. It’s hard to describe to people who haven’t experienced it.
We are not free to say whatever we like about the wild entities we make up. They require definition, and having been defined, they are no more psychedelic than trees and fish; they are what they are. To do mathematics is to be, at once, touched by fire and bound by reason. This is no contradiction. Logic forms a narrow channel through which intuition flows with vastly augmented force.
The lessons of mathematics are simple ones and there are no numbers in them: that there is structure in the world; that we can hope to understand some of it and not just gape at what our senses present to us; that our intuition is stronger with a formal exoskeleton than without one. And that mathematical certainty is one thing, the softer convictions we find attached to us in everyday life another, and we should keep track of the difference if we can.
Every time you observe that more of a good thing is not always better; or you remember that improbable things happen a lot, given enough chances, and resist the lure of the Baltimore stockbroker; or you make a decision based not just on the most likely future, but on the cloud of all possible futures, with attention to which ones are likely and which ones are not; or you let go of the idea that the beliefs of groups should be subject to the same rules as beliefs of individuals; or, simply, you find that cognitive sweet spot where you can let your intuition run wild on the network of tracks formal reasoning makes for it; without writing down an equation or drawing a graph, you are doing mathematics, the extension of common sense by other means. When are you going to use it? You’ve been using mathematics since you were born and you’ll probably never stop. Use it well.
BOOLE MICROCAP FUND
An equal weighted group of micro caps generally far outperforms an equal weighted (or cap-weighted) group of larger stocks over time. See the historical chart here: https://boolefund.com/best-performers-microcap-stocks/
This outperformance increases significantly by focusing on cheap micro caps. Performance can be further boosted by isolating cheap microcap companies that show improving fundamentals. We rank microcap stocks based on these and similar criteria.
There are roughly 10-20 positions in the portfolio. The size of each position is determined by its rank. Typically the largest position is 15-20% (at cost), while the average position is 8-10% (at cost). Positions are held for 3 to 5 years unless a stock approachesintrinsic value sooner or an error has been discovered.
The mission of the Boole Fund is to outperform the S&P 500 Index by at least 5% per year (net of fees) over 5-year periods. We also aim to outpace the Russell Microcap Index by at least 2% per year (net). The Boole Fund has low fees.
If you are interested in finding out more, please e-mail me or leave a comment.
My e-mail: jb@boolefund.com
Disclosures: Past performance is not a guarantee or a reliable indicator of future results. All investments contain risk and may lose value. This material is distributed for informational purposes only. Forecasts, estimates, and certain information contained herein should not be considered as investment advice or a recommendation of any particular security, strategy or investment product. Information contained herein has been obtained from sources believed to be reliable, but not guaranteed. No part of this article may be reproduced in any form, or referred to in any other publication, without express written permission of Boole Capital, LLC.
I agree with you