In today’s blog post, I review some lessons from Michael Mauboussin’s excellent book Think Twice: Harnessing the Power of Counterintuition. Each chapter is based on a common mistake in decision-making:
- RQ vs. IQ
- The Outside View
- Open to Options
- The Expert Squeeze
- Situational Awareness
- More Is Different
- Evidence of Circumstance
- Phase Transitions–”Grand Ah-Whooms”
- Sorting Luck From Skill
- Time to Think Twice

RQ vs IQ
Given a proper investment framework or system, obviously IQ can help a great deal over time. Warren Buffett and Charlie Munger are seriously smart. But they wouldn’t have become great investors without a lifelong process of learning and improvement, including learning how to be rational. The ability to be rational may be partly innate, but it can be improved–sometimes significantly–with work.

An investor dedicated to lifelong improvements in knowledge and rationality can do well in value investing even without being brilliant. A part of rationality is focusing on the knowable and remembering the obvious.
“We try more to profit from always remembering the obvious than from grasping the esoteric. It is remarkable how much long-term advantage people like us have gotten by trying to be consistently not stupid, instead of trying to be very intelligent.” – Charlie Munger
Quite often, the best approach for a value investor is to invest in an index fund or in a quantitative value fund. Lifelong improvements are still helpful in these cases. Many value investors, including the father of value investing Ben Graham, have advocated and used a quantitative approach.
THE OUTSIDE VIEW
Mauboussin discusses why Big Brown was a bad bet to win the Triple Crown in 2008. Big Brown had won the Kentucky Derby by four-and-three-quarters lengths, and he won the Preakness by five-and-one-quarter lengths. The horse’s trainer, Rick Dutrow, said, “He looks as good as he can possibly look. I can’t find any flaws whatsoever in Big Brown. I see the prettiest picture. I’m so confident, it’s unbelievable.” UPS (after whom Big Brown was named) signed a marketing deal. And enthusiasm for Big Brown’s chances in the Belmont Stakes grew.

(Photo of Big Brown by Naoki Nakashima, via Wikimedia Commons)
What happened? Big Brown trailed the field during the race, so his jockey eased him out of the race. This was a shocking result. But the result of not winning could have been much more widely anticipated if people had used the outside view.
The outside view means identifying similar situations and finding the statistics on how things worked out. Renowned handicapper Steven Crist developed an outside view, as Mauboussin summarizes:
Of the twenty-nine horses with a chance to capture the Triple Crown after winning the Kentucky Derby and the Preakness Stakes, only eleven triumphed, a success rate less than 40 percent. But a closer examination of those statistics yielded a stark difference before and after 1950. Before 1950, eight of the nine horses attempting to win the Triple Crown succeeded. After 1950, only three of twenty horses won. It’s hard to know why the achievement rate dropped from nearly 90 percent to just 15 percent, but logical factors include better breeding (leading to more quality foals) and bigger starting fields.
Most people naturally use the inside view. This essentially means looking at more subjective factors that are close at hand, like how tall and strong the horse looks and the fact that Big Brown had handily won the Kentucky Derby and the Preakness.
Why do people naturally adopt the inside view? Mauboussin gives three reasons:
- the illusion of superiority
- the illusion of optimism
- the illusion of control
First is the illusion of superiority. Most people say they are above average in many areas, such as looks, driving, judging humor, investing. Most people have an unrealistically positive view of themselves. In many areas of life, this does not cause problems. In fact, unrealistic positivity may often be an advantage that helps people to persevere. But in zero-sum games–like investing–where winning requires clearly being above average, the illusion of superiority is harmful.

Munger calls it the Excessive Self-Regard Tendency. Munger also notes that humans tend to way overvalue the things they possess–the endowment effect. This often causes someone already overconfident about a bet he is considering to become even more overconfident after making the bet.
The illusion of optimism, which is similar to the illusion of superiority, causes most people to see their future as brighter than that of others.
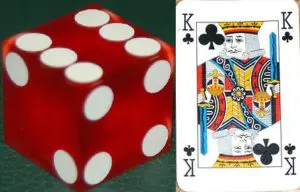
The illusion of control causes people to behave as if chance events are somehow subject to their control. People throwing dice throw softly when they want low numbers and hard for high numbers. A similar phenomenon is seen when people choose which lottery card to take, as opposed to getting one by chance.
Mauboussin observes that a vast range of professionals tends to use the inside view to make important decisions, with predictably poor results.
Encouraged by the three illusions, most believe they are making the right decision and have faith that the outcomes will be satisfactory.
In the world of investing, many investors believe that they will outperform the market over time. However, after several decades, there are very few investors who have done better than the market.
Another area where people fall prey to the three illusions is mergers and acquisitions. Two-thirds of acquisitions fail to create value, but most executives, relying on the inside view, believe that they can beat the odds.
The planning fallacy is yet another example of how most people rely on the inside view instead of the outside view. Mauboussin gives one common example of students estimating when they’d finish an assignment:
…when the deadline arrived for which the students had given themselves a 50 percent chance of finishing, only 13 percent actually turned in their work. At the point when the students thought there was 75 percent chance they’d be done, just 19 percent had completed the project. All the students were virtually sure they’d be done by the final date. But only 45 percent turned out to be right.

Daniel Kahneman gives his own example of the planning fallacy. He was part of a group assembled to write a curriculum to teach judgment and decision-making to high school students. Kahneman asked everyone in the group to write down their opinion of when they thought the group would complete the task. Kahneman found that the average was around two years, and everyone, including the dean, estimated between eighteen and thirty months.
Kahneman then realized that the dean had participated in similar projects in the past. Kahneman asked the dean how long it took them to finish.
The dean blushed and then answered that 40 percent of the groups that had started similar programs had never finished, and that none of the groups completed it in less than seven years. Kahneman then asked how good this group was compared to past groups. The dean thought and then replied: ‘Below average, but not by much.’
OPEN TO OPTIONS
In making decisions, people often fail to consider a wide enough range of alternatives. People tend to have “tunnel vision.”
Anchoringis an important example of this mistake. Mauboussin:
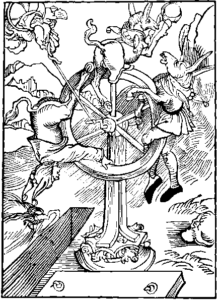
Kahneman and Amos Tversky asked people what percentage of the UN countries is made up of African nations. A wheel of fortune with the numbers 1 to 100 was spun in front of the participants before they answered. The wheel was rigged so it gave either 10 or 65 as the result of a spin. The subjects were then asked–before giving their specific prediction–if the answer was higher or lower than the number on the wheel. The median response from the group that saw the wheel stop at 10 was 25%, and the median response from the group that saw 65 was 45%.

(Illustration by Olga Vainshtein)
Behavioral finance expert James Montier has run his own experiment onanchoring. People are asked to write down the last four digits of their phone number. Then they are asked whether the number of doctors in their capital city is higher or lower than the last four digits of their phone number. Results: Those whose last four digits were greater than 7000 on average report 6762 doctors, while those with telephone numbers below 2000 arrived at an average 2270 doctors.
Stock prices often have a large component of randomness, but investors tend to anchor on various past stock prices. The rational way to avoid such anchoring is to carefully develop different possible scenarios for the intrinsic value of a stock. For instance, you could ask:
- What is the business worth if things go better than expected?
- What is the business worth if things go as expected? Or: What is the business worth under normal conditions?
- What is the business worth if things go worse than expected?
Ideally, you would not want to know about past stock prices–or even the current stock price–before developing the intrinsic value scenarios.
The Representativeness Heuristic
The representativeness heuristic is another bias that leads many people not to consider a wide range of possibilities. Daniel Kahneman and Amos Tversky defined representativeness as “the degree to which [an event] (i) is similar in essential characteristics to its parent population, and (ii) reflects the salient features of the process by which it is generated.”
People naturally tend to believe that something that is more representative is more likely. But frequently that’s not the case. Here is an example Kahneman and Tversky have used:
“Steve is very shy and withdrawn, invariably helpful but with very little interest in people or in the world of reality. A meek and tidy soul, he has a need for order and structure, and a passion for detail. Question: Is Steve more likely to be a librarian or a farmer?”
Most people say “a librarian.” But the fact that the description seems more representative of librarians than of farmers does not mean that it is more likely that Steve is a librarian. Instead, one must look at the base rate: there are twenty times as many farmers as librarians, so it is far more likely that Steve is a farmer.
Another example Kahneman gives:
“Linda is 31 years old, single, outspoken, and very bright. She majored in philosophy. As a student, she was deeply concerned with issues of discrimination and social justice, and also participated in anti-nuclear demonstrations. Question: Which is more probable?
- Linda is a bank teller.
- Linda is a bank teller and is active in the feminist movement.”
Most people say the second option is more likely. But just using simple logic, we know that the second option is a subset of the first option, so the first option is more likely. Most people get this wrong because they use the representativeness heuristic.
Availability Bias, Vividness Bias, Recency Bias
If a fact is easily available–which often happens if a fact is vivid or recent–people generally far overestimate its probability.
A good example is a recent and vivid plane crash. The odds of dying in a plane crash are one in 11 million–astronomically low. The odds of dying in a car crash are one in five thousand. But many people, after seeing recent and vivid photos of a plane crash, decide that taking a car is much safer than taking a plane.
Extrapolating the Recent Past
Most people automatically extrapolate the recent past into the future without considering various alternative scenarios. To understand why, consider Kahneman’s definitions of two systems in the mind, System 1 and System 2:
System 1: Operates automatically and quickly; makes instinctual decisions based on heuristics.
System 2: Allocates attention (which has a limited budget) to the effortful mental activities that demand it, including logic, statistics, and complex computations.
In Thinking, Fast and Slow,Kahneman writes that System 1 and System 2 work quite well on the whole:
The division of labor between System 1 and System 2 is highly efficient: it minimizes effort and optimizes performance. The arrangement works well most of the time because System 1 is generally very good at what it does: its models of familiar situations are accurate, its short-term predictions are usually accurate as well, and its initial reactions to challenges are swift and generally appropriate. System 1 has biases, however, systematic errors that it is prone to make in specified circumstances. As we shall see, it sometimes answers easier questions than the one it was asked, and it has little understanding of logic and statistics.
System 1 is automatic and quick, and it works remarkably well much of the time. Throughout most of our evolutionary history, System 1 has been instrumental in keeping us alive. However, when we were hunter-gatherers, the recent past was usually the best guide to the future.
- If there was a rustling in the grass or any other sign of a predator, the brain automatically went on high alert, which was useful because otherwise you weren’t likely to survive long. A statistical calculation wasn’t needed.
- There were certain signs indicating the potential presence of animals to hunt or wild plants to collect. You learned to recognize those signs. You foraged or you died. You didn’t need to know any statistics.
- Absent any potential threats, and assuming enough to eat, then things were fine and you could relax for a spell.
In today’s world–unlike when we were hunter-gatherers–the recent past is often a terrible guide to the future. For instance, when it comes to investing, extrapolating the recent past is one of the biggest mistakes that investors make. In a highly random environment, you should expect reversion to the mean, rather than a continuation of the recent past. Investors must learn to think counterintuitively. That includes thinking probabilistically–in terms of possible scenarios and reversion to the mean.
Doubt Avoidance
Charlie Munger–see Poor Charlie’s Almanack, Expanded Third Edition–explains what he calls Doubt Avoidance Tendency as follows:
“The brain of man is programmed with a tendency to quickly remove doubt by reaching some decision.”
System 1 is designed (by evolution) to jump to conclusions. In the past, when things were simpler and less probabilistic, the ability to make a quick decision was beneficial. In today’s complex world, you must train yourself to slow down when facing an importantdecision under uncertainty–a decision that depends on possible scenarios and their associated probabilities.
The trouble is that our mind–due to System 1–wants to jump immediately to a conclusion, even more so if we feel pressured, puzzled, or stressed. Munger explains:
What triggers Doubt-Avoidance Tendency? Well, an unthreatened man, thinking of nothing in particular, is not being prompted to remove doubt through rushing to some decision. As we shall see later when we get to Social-Proof Tendency and Stress-Influence Tendency, what usually triggers Doubt-Avoidance Tendency is some combination of (1) puzzlement and (2) stress…
The fact that social pressure and stress trigger the Doubt-Avoidance Tendency supports the notion that System 1 excelled at keeping us alive when we lived in a much more primitive world. In that type of environment where things usually were what they seemed to be, the speed of System 1 in making decisions was vital. If the group was running in one direction, the immediate, automatic decision to follow was what kept you alive over time.
Inconsistency Avoidance and Confirmation Bias
Munger on the Inconsistency-Avoidance Tendency:
The brain of man conserves programming space by being reluctant to change, which is a form of inconsistency avoidance. We see this in all human habits, constructive and destructive. Few people can list a lot of bad habits that they have eliminated, and some people cannot identify even one of these. Instead, practically everyone has a great many bad habits he has long maintained despite their being known as bad…. chains of habit that were too light to be felt before they became too heavy to be broken.
The rare life that is wisely lived has in it many good habits maintained and many bad habits avoided or cured.

Munger continues:
It is easy to see that a quickly reached conclusion, triggered by Doubt-Avoidance Tendency, when combined with a tendency to resist any change in that conclusion, will naturally cause a lot of errors in cognition for modern man. And so it observably works out…
And so, people tend to accumulate large mental holdings of fixed conclusions and attitudes that are not often reexamined or changed, even though there is plenty of good evidence that they are wrong.
Our brain will jump quickly to a conclusion and then resist any change in that conclusion. How do we combat this tendency? One great way to overcome first conclusion bias is to train our brains to emulate Charles Darwin:
One of the most successful users of an antidote to first conclusion bias was Charles Darwin. He trained himself, early, to intensively consider any evidence tending to disconfirm any hypothesis of his, more so if he thought his hypothesis was a particularly good one. The opposite of what Darwin did is now called confirmation bias, a term of opprobrium. Darwin’s practice came from his acute recognition of man’s natural cognitive faults arising from Inconsistency-Avoidance Tendency.He provides a great example of psychological insight correctly used to advance some of the finest mental work ever done.(my emphasis)
Selective Attention and Inattentional Blindness
We tend to be very selective about what we hear and see, and this is partly a function of what we already believe. We often see and hear only what we want, and tune out everything else.
On a purely visual level, there is something called inattentional blindness. When we focus on certain aspects of our environment, this causes many of us to miss other aspects that are plainly visible. There is a well-known experiment related to inattentional blindness. People watch a thirty-second video that shows two teams, one wearing white and the wearing black. Each team is passing a basketball back and forth. In the middle of the video, a woman wearing a gorilla suit walks into the middle of the scene, thumps her chest, and walks off. Roughly half of the people watching the video have no recollection of the gorilla.
Struggles and Stresses
Stress or fatigue causes many of us to make poorer decisions than we otherwise would. Thus, we must take care. With the right attitude, however, stress can slowly be turned into an advantage over a long period of time.
As Ray Dalio and Charlie Munger have pointed out, mental strength is one of life’s greatest gifts. With a high degree of focus and discipline, a human being can become surprisingly strong and resilient. But this typically only happens gradually, over the course of years or decades, as the result of an endless series of struggles, stresses, and problems.
A part of strength that can be learned over time is inner peace or total calm in the face of seemingly overwhelming difficulties. The practice of transcendental meditation is an excellent way to achieve inner peace and total calm in the face of any adversity. But there are other ways, too.
Wise men such as Munger or Lincoln are of the view that total calm in the face of any challenge is simply an aspect of mental strength that can be developed over time. Consider Rudyard Kipling’s poem “If”:
If you can keep your head when all about youAre losing theirs and blaming it on you,If you can trust yourself when all men doubt you,But make allowance for their doubting too;If you can wait and not be tired by waiting,Or being lied about, don’t deal in lies,Or being hated, don’t give way to hating,And yet don’t look too good, nor talk too wise…
…So, maybe in that sense I think a tougher hand has been good for us. My answer to that question reminds me of my old Harvard law professor who used to say, ‘Charlie, let me know what your problem is and I’ll try to make it harder for you.’ I’m afraid that’s what I’ve done to you.
As for how do I understand a new industry: the answer is barely. I just barely have enough cognitive ability to do what I do. And that’s because the world promoted me to the place where I’m stressed. And you’re lucky if it happens to you, because that’s what you want to end up: stressed. You want to have your full powers called for. Believe you me, I’ve had that happen all my life. I’ve just barely been able to think through to the right answer, time after time. And sometimes I’ve failed…
Link to 2016 Daily Journal Meeting Notes (recorded courtesy of Whitney Tilson): https://www.scribd.com/doc/308879985/MungerDJ-2-16
Incentives
Mauboussin writes about the credit crisis of 2007-2008. People without credit could buy nice homes. Lenders earned fees and usually did not hold on to the mortgages. Investment banks bought mortgages and bundled them for resale, earning a fee. Rating agencies were paid to rate the mortgage-backed securities, and they rated many of them AAA (based partly on the fact that home prices had never declined nationwide). Investors worldwide in AAA-rated mortgage-backed securities earned higher returns than they did on other AAA issues. Some of these investors were paid based on portfolio performance and thus earned higher fees this way.
Incentives are extremely important:
“Never, ever think about something else when you should be thinking about incentives.” – Charlie Munger
Under a certain set of incentives, many people who normally are good people will behave badly. Often this bad behavior is not only due to the incentives at play, but also involves other psychological pressures like social proof, stress, and doubt-avoidance. A bad actor could manipulate basically good people to do bad things using social proof and propaganda. If that fails, he could use bribery or blackmail.
Finally, Mauboussin offers advice about how to deal with “tunnel vision,” or the insufficient consideration of alternatives:
- Explicitly consider alternatives.
- Seek dissent. (This is very difficult, but highly effective. Think of Lincoln’s team of rivals.)
- Keep track of previous decisions. (A decision journal does not cost much, but it can help one over time to make better decisions.)
- Avoid making decisions while at emotional extremes. (One benefit to meditation–in addition to total calm and rationality–is that it can give you much greater self-awareness. You can learn to accurately assess your emotional state, and you can learn to postpone important decisions if you’re too emotional or tired.)
- Understand incentives.
THE EXPERT SQUEEZE
In business today, there are many areas where you can get better insights or predictions than what traditional experts can offer.
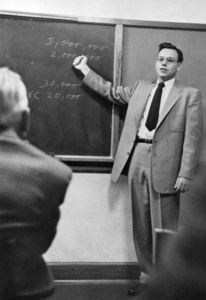
Mauboussin gives the example of Best Buy forecasting holiday sales. In the past, Best Buy depended on specialists to make these forecasts. James Surowiecki, author of The Wisdom of Crowds, went to Best Buy’s headquarters and told them that a crowd could predict better than their specialists could.
Jeff Severts, a Best Buy executive, decided to test Surowiecki’s suggestion. Late in 2005, Severts set up a location for employees to submit and update their estimates of sales from Thanksgiving to year-end. In early 2006, Severts revealed that the internal experts had been 93 percent accurate, while the “amateur crowd” was off only one-tenth of one percent. Best Buy then allocated more resources to its prediction market, and benefited.
Another example of traditional experts being supplanted: Orley Ashenfelter, wine lover and economist, figured out a simple regression equation that predicts the quality of red wines from France’s Bordeaux region better than most wine experts. Mauboussin:
With the equation in hand, the computer can deliver appraisals that are quicker, cheaper, more reliable, and without a whiff of snobbishness.
Mauboussin mentions four categories over which we can judge experts versus computers:
Rule based; limited range of outcomes–experts are generally worse than computers. Examples include credit scoring and simple medical diagnosis.
Rule based; wide range of outcomes–experts are generally better than computers. But this may be changing. For example, humans used to be better at chess and Go, but now computers are far better than humans.
Probabilistic; limited range of outcomes–experts are equal or worse than collectives. Examples include admissions officers and poker.
Probabilistic; wide range of outcomes–experts are worse than collectives. Examples include forecasting any of the following: stock prices, the stock market, interest rates, or the economy.
Regarding areas that are probabilistic, with a wide range of outcomes (the fourth category), Mauboussin comments on economic and political forecasts:
The evidence shows that collectives outperform experts in solving these problems. For instance, economists are extremely poor forecasters of interest rates, often failing to accurately guess the direction of rate moves, much less their correct level. Note, too, that not only are experts poor at predicting actual outcomes, they rarely agree with one another. Two equally credentialed experts may make opposite predictions and, hence, decisions from one another.
Mauboussin notes that experts do relatively well with rule-based problems with a wide range of outcomes because they can be better than computers at eliminating bad choices and making creative connections between bits of information. A fascinating example: Eric Bonabeau, a physicist, has developed programs that generate alternative designs for packaging using the principles of evolution (recombination and mutation). But the experts select the best designs at the end of the process, since the computers have no taste.
Yet computers will continue to make big improvements in this category (rule-based problems with a wide range of outcomes). For instance, many chess programs today can beat any human, whereas there was only one program (IBM’s Deep Blue) that could do this in the late 1990’s. Also, in October 2015, Google DeepMind’s program AlphaGo beat Fan Hui, the European Go champion.
Note: We still need experts to make the systems that replace them. Severts had to set up the prediction market. Ashenfelter had to find the regression equation. And experts need to stay on top of the systems, making improvements when needed.
Also, experts are still needed for many areas in strategy, including innovation and creativity. And people are needed to deal with people. (Although many jobs will soon be done by robots.)
I’ve written before about how simple quant models outperform experts in a wide variety of areas: https://boolefund.com/simple-quant-models-beat-experts-in-a-wide-variety-of-areas/
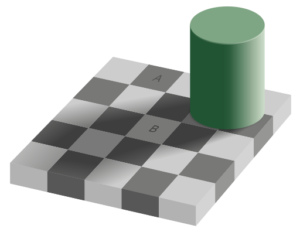
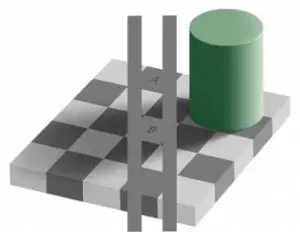
SITUATIONAL AWARENESS
Mauboussin writes about the famous experiment by Solomon Asch. The subject is shown lines of obviously different lengths. But in the same room with the subject are shills, who unbeknownst to the subject have already been instructed to say that two lines of obviously different lengths actually have the same length. So the subject of the experiment has to decide between the obvious evidence of his eyes–the two lines are clearly different lengths–and the opinion of the crowd. A significant number (36.8 percent) ignored their own eyes and went with the crowd, saying that the two lines had equal length, despite the obvious fact that they didn’t.

(Photo by D-janous, via Wikimedia Commons)
Mauboussin notes that the interesting question about the Solomon Asch experiment is: what’s going on in the heads of people who conform? Asch himself suggested three possibilities:
Distortion of judgment. The subjects conclude that their perceptions are wrong and that the group is right.
Distortion of action. These individuals suppress their own knowledge in order to go with the majority.
Distortion of perception. This group is not aware that the majority opinion distorts their estimates.
Unfortunately, Asch didn’t have the tools to try to test these possibilities. Gregory Berns, a neuroscientist, five decades after Asch, used functional magnetic resonance imaging (fMRI) in the lab at Emory University.
For the conforming subjects, the scientists found activity in the areas of the brain that were related to perception of the object. Also, the scientists did not find a meaningful change in activity in the frontal lobe–an area associated with activities like judgment. Thus, for conforming subjects, it is a distortion of perception: what the majority claims to see, the subject actually does see. Remarkable.
What about the people who remained independent when faced with the group’s wrong responses? Those subjects showed increased activity in the amygdala, a region that signals to prepare for immediate action (fight or flight). Mauboussin comments: “…while standing alone is commendable, it is unpleasant.”
Priming
Mauboussin:
How do you feel when you read the word ‘treasure’? … If you are like most people, just ruminating on ‘treasure’ gives you a little lift. Our minds naturally make connections and associate ideas. So if someone introduces a cue to you–a word, a smell, a symbol–your mind often starts down an associative path. And you can be sure the initial cue will color a decision that waits at the path’s end. All this happens outside your perception.

(Subconscious as brain under water, Illustration by Agawa288)
Scientists did the following experiment:
In this test, the researchers placed the French and German wines next to each other, along with small national flags. Over two weeks, the scientists alternated playing French accordion music and German Bierkeller pieces and watched the results. When French music played, French wines represented 77 percent of the sales. When German music played, consumers selected German wines 73 percent of the time… The music made a huge difference in shaping purchases. But that’s not what the shoppers thought…
While the customers acknowledged that the music made them think of either France or Germany, 86 percent denied that the tunes had any influence on their choice. This experiment is an example of priming, which psychologists formally define as ‘the incidental activation of knowledge structures by the current situational context.’ In other words, what comes in through our senses influences how we make decisions, even when it seems completely irrelevant in a logical sense. Priming is by no means limited to music. Researchers have manipulated behavior through exposure to words, smells, and visual backgrounds.
Mauboussin gives some examples of priming:
- Immediately after being exposed to words associated with the elderly, primed subjects walked 13 percent slower than subjects seeing neutral words.
- Exposure to the scent of an all-purpose cleaner prompted study participants to keep their environment tidier while eating a crumbly biscuit.
- Subjects reviewing Web pages describing two sofa models preferred the more comfortable model when they saw a background with puffy clouds, and favored the cheaper sofa when they saw a background with coins.
The Fault of the Default
While virtually 100 percent of Austrians have consented to be an organ donor, only 12 percent of Germans have. The difference is due entirely to how the choice is presented. In Austria, you must opt-out of being an organ donor–being an organ donor is the default choice. In Germany, you must opt-in to being an organ donor–not being a donor is the default choice. But this directly translates into many more saved lives in Austria than in Germany.

Mauboussin makes an important larger point. We tend to assume that people decide what is best for them independent of how the choice is framed, but in reality, “many people simply go with the default options.” This includes consequential areas (in addition to organ donation) like savings, educational choice, medical alternatives, etc.
The Power of Inertia
To overcome inertia, Peter Drucker suggested asking: “If we did not do this already, would we, knowing what we now know, go into it?”
Dr. Atul Gawande, author of The Checklist Manifesto, tells the story of Dr. Peter Pronovost, an anesthesiologist and critical-care specialist at the Johns Hopkins Hospital. Pronovost’s father died due to a medical error, which led Pronovost to dedicate his career to ensuring the safety of patients. Mauboussin explains:
In the United States, medical professionals put roughly 5 million lines into patients each year, and about 4 percent of those patients become infected within a week and a half. The added cost of treating those patients is roughly $3 billion per year, and the complications result in twenty to thirty thousand annual preventable deaths.
Pronovost came up with a simple checklist because he observed that physicians in a hurry would often overlook some simple routine that is normally done as a part of safety. It saved numerous lives and millions of dollars in the first few years at Johns Hopkins Hospital, so Pronovost got the Michigan Health & Hospital Association to try the checklist. After just three months, the rate of infection dropped by two-thirds. After eighteen months, the checklist saved 1,500 lives and nearly $200 million.
MORE IS DIFFERENT
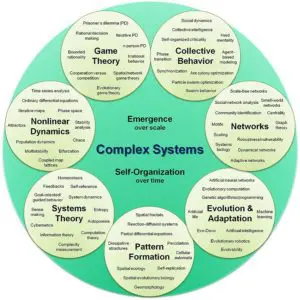
Mauboussin covers complex adaptive systems such as the stock market or the economy. His advice, when dealing with a complex adaptive system, is:
- Consider the system at the correct level. An individual agent in the system can be very different from one outside the system.
- Watch for tightly coupled systems. A system is tightly coupled when there is no slack between items, allowing a process to go from one stage to the next without any opportunity to intervene. (Examples include space missions and nuclear power plants.) Most complex adaptive systems are loosely coupled, where removing or incapacitating one or a few agents has little impact on the system’s performance.
- Use simulations to create virtual worlds. Simulation is a tool that can help our learning process. Simulations are low cost, provide feedback, and have proved their value in other domains like military planning and pilot training.
Mauboussin notes that complex adaptive systems often perform well at the system level, despite dumb agents (consider ants or bees). Moreover, there are often unintended consequences that can lead to failure when well-meaning humans try to manage a complex system towards a particular goal.
EVIDENCE OF CIRCUMSTANCE
Decisions that work well in one context can often fail miserably in a different context. The right answer to many questions that professionals face is: “It depends.”
Mauboussin writes about how most people make decisions based on a theory, even though often they are not aware of it. Two business professors, Paul Carlile and Clayton Christensen, describe three stages of theory building:
- The first stage is observation, which includes carefully measuring a phenomenon and documenting the results. The goal is to set common standards so that subsequent researchers can agree on the subject and the terms to describe it.
- The second stage is classification, where researchers simplify and organize the world into categories to clarify the differences among phenomena. Early in theory development, these categories are based predominantly on attributes.
- The final stage is definition, or describing the relationship between the categories and the outcomes. Often, these relationships start as simple correlations.
What’s especially important, writes Mauboussin:
Theories improve when researchers test predictions against real-world data, identify anomalies, and subsequently reshape the theory. Two crucial improvements occur during this refining process. In the classification stage, researchers evolve the categories to reflect circumstances, not just attributes. In other words, the categories go beyond what works to when it works. In the definition stage, the theory advances beyond simple correlations and sharpens to define causes–why it works. This pair of improvements allows people to go beyond crude estimates and to tailor their choices to the situation they face.
Here is what is often done: Some successes are observed, some common attributes are identified, and it is proclaimed that these attributes can lead others to success. This doesn’t work.

By the same logic, a company should not adopt a strategy without understanding the conditions under which it succeeds or fails. Mauboussin gives the example of Boeing outsourcing both the design and the building of sections of the Dreamliner to its suppliers. This was a disaster. Boeing had to pull the design work back in-house.
The Colonel Blotto Game
Each player gets a hundred soldiers (resources) to distribute across three battlefields (dimensions). The players make their allocations in secret. Then the players’ choices are simultaneously revealed, and the winner of each battle is whichever army has more soldiers in that battlefield. The overall winner is whichever player wins the most battles. What’s interesting is how the game changes as you adjust one of the two parameters (resources, dimensions).
Mauboussin observes that it’s not intuitive how much advantage additional points give to one side in a three-battlefield game:
In a three-battlefield game, a player with 25 percent more resources has a 60 percent expected payoff (the proportion of battles the player wins), and a player with twice the resources has a 78 percent expected payoff. So some randomness exists, even in contests with fairly asymmetric resources, but the resource-rich side has a decisive advantage. Further, with low dimensions, the game is largely transitive: if A can beat B and B can beat C, then A can beat C. Colonel Blotto helps us to understand games with few dimensions, such as tennis.
Things can change even more unexpectedly when the number of dimensions is increased:
But to get the whole picture of the payoffs, we must introduce the second parameter, the number of dimensions or battlefields. The more dimensions the game has, the less certain the outcome (unless the players have identical resources). For example, a weak player’s expected payoff is nearly three times higher in a game with fifteen dimensions than in a nine-dimension game. For this reason, the outcome is harder to predict in a high-dimension game than in a low-dimension game, and as a result there are more upsets. Baseball is a good example of a high-dimension game…
What may be most surprising is that the Colonel Blotto game is highly nontransitive (except for largely asymmetric, low-dimension situations). This means that tournaments often fail to reveal the best team. Mauboussin gives an example where A beats B, B beats C, C beats A, and all of them beat D. Because there is no best player, the winner of a tournament is simply “the player who got to play D first.” Mauboussin:
Because of nontransitivity and randomness, the attribute of resources does not always prevail over the circumstance of dimensionality.
Bottom Line on Attributes vs. Circumstances
Mauboussin sums up the main lesson on attributes versus circumstances:
Most of us look forward to leveraging our favorable experiences by applying the same approach to the next situation. We also have a thirst for success formulas–key steps to enrich ourselves. Sometimes our experience and nostrums work, but more often they fail us. The reason usually boils down to the simple reality that the theories guiding our decisions are based on attributes, not circumstances. Attribute-based theories come very naturally to us and often appear compelling… However, once you realize the answer to most questions is, ‘It depends,’ you are ready to embark on the quest to figure out what it depends on.
PHASE TRANSITIONS–”GRAND AH-WHOOMS”
Just a small incremental change in temperature leads to a change from solid to liquid or from liquid to gas. Philip Ball, a physicist and author of Critical Mass: How One Thing Leads to Another, calls it a grand ah-whoom.
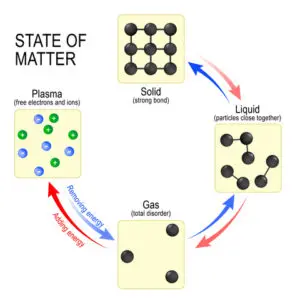
(Illustration by Designua)
Critical Points, Extremes, and Surprise
In part due to the writings of Nassim Taleb, people are more aware of black swans, or extreme outcomes within a power law distribution. According to Mauboussin, however, what most people do not yet appreciate is how black swans are caused:
Here’s where critical points and phase transitions come in. Positive feedback leads to outcomes that are outliers. And critical points help explain our perpetual surprise at black swan events because we have a hard time understanding how such small incremental perturbations can lead to such large outcomes.
Mauboussin explains critical points in social systems. Consider the wisdom of crowds: Crowds tend to make accurate predictions when three conditions prevail–diversity, aggregation, and incentives.
Diversity is about people having different ideas and different views of things. Aggregation means you can bring the group’s information together. Incentives are rewards for being right and penalties for being wrong that are often, but not necessarily, monetary.
Mauboussin continues:
For a host of psychological and sociological reasons, diversity is the most likely condition to fail when humans are involved. But what’s essential is that the crowd doesn’t go from smart to dumb gradually. As you slowly remove diversity, nothing happens initially. Additional reductions may also have no effect. But at a certain critical point, a small incremental reduction causes the system to change qualitatively.
Blake LeBaron, an economist at Brandeis University, has done an experiment. LaBaron created a thousand investors within the computer and gave them money, guidelines on allocating their portfolios, and diverse trading rules. Then he let the system play out. As Mauboussin describes:
His model was able to replicate many of the empirical features we see in the real world, including cycles of booms and crashes. But perhaps his most important finding is that a stock price can continue to rise even while the diversity of decision rules falls. Invisible vulnerability grows. But then, ah-whoom, the stock price tumbles as diversity rises again. Writes LaBaron, ‘During the run-up to a crash, population diversity falls. Agents begin using very similar trading strategies as their common good performance is reinforced. This makes the population very brittle, in that a small reduction in the demand for shares could have a strong destabilizing impact on the market.’
The Problem of Induction, Reductive Bias, and Bad Predictions
Extrapolating from what we see or have seen, to what will happen next, is a common decision-making mistake. Nassim Taleb retells Bertrand Russell’s story of a turkey (Taleb said turkey instead of chicken to suit his American audience). The turkey is fed a thousand days in a row. The turkey feels increasingly good until the day before Thanksgiving, when an unexpected event occurs. None of the previous one thousand days has given the turkey any clue about what’s next. Mauboussin explains:
The equivalent of the turkey’s plight–sharp losses following a period of prosperity–has occurred repeatedly in business. For example, Merrill Lynch (which was acquired by Bank of America) suffered losses over a two-year period from 2007 to 2008 that were in excess of one-third of the profits it had earned cumulatively in its thirty-six years as a public company….
The term black swan reflects the criticism of induction by the philosopher Karl Popper. Popper argued that seeing lots of white swans doesn’t prove the theory that all swans are white, but seeing one black swan does disprove it. So Popper’s point is that to understand a phenomenon, we’re better off focusing on falsification than on verification. But we’re not naturally inclined to falsify something.

Not only does System 1 naturally look for confirming evidence. But even System 2 uses a positive test strategy, looking for confirming evidence for any hypothesis, rather than looking for disconfirming evidence.
People have a propensity to stick to whatever they currently believe. Most people rarely examine or test their beliefs (hypotheses). As Bertrand Russell pointed out:
Most people would rather die than think; many do.
People are generally overconfident. Reductive bias means that people tend to believe that reality is much simpler and more predictable than it actually is. This causes people to oversimplify complex phenomena. Instead of properly addressing the real questions–however complex and difficult–System 1 naturally substitutes an easier question. The shortcuts used by System 1 work quite well in simple environments. But these same shortcuts lead to predictable errors in complex and random environments.
System 2–which can be trained to do logic, statistics, and complex computations–is naturally lazy. It requires conscious effort to activate System 2 . If System 1 recognizes a serious threat, then System 2 can be activated if needed.
The problem is that System 1 does not recognize the dangers associated with complex and random environments. Absent an obvious threat, System 1 will nearly always oversimplify complex phenomena. This creates overconfidence along with comforting illusions–”everything makes sense” and “everything is fine.” But complex systems frequently undergo phase transitions, and some of these new phases have sharply negative consequences, especially when people are completely unprepared.
Even very smart people routinely oversimplify and are inclined to trust overly simple mathematical models–for instance, models that assume a normal distribution even when the distribution is far from normal. Mauboussin argues that Long-Term Capital Management, which blew up in the late 1990’s, had oversimplified reality by relying too heavily on its financial models. According to their models, the odds of LTCM blowing up–as it did–were astronomically low (1 out of billions). Clearly their models were very wrong.
Mauboussin spoke with Benoit Mandelbrot, the French mathematician and father of fractal geometry. Mauboussin asked about the reductive bias. Mandelbrot replied that the wild randomness of stock markets was clearly visible for all to see, but economists continued to assume mild randomness, largely because it simplified reality and made the math more tractable. If you assume a normal distribution, the math is much easier than if you tried to capture the wildness and complexity of reality:
Mandelbrot emphasized that while he didn’t know what extreme event was going to happen in the future, he was sure that the simple models of the economists would not anticipate it.
Mauboussin gives the example of David Li’s formula, which measures the correlation of default between assets. (The formula is known as a Gaussian copula function.) Li’s equation could measure the likelihood that two or more assets within a portfolio would default at the same time. This “opened the floodgates” for financial engineers to create new products, including collateralized debt obligations (bundles of corporate bonds), and summarize the default correlation using Li’s equation “rather than worry about the details of how each corporate bond within the pool would behave.”
Unfortunately, Li’s equation oversimplified a complex world: Li’s equation did not make any adjustments for the fact that many correlations can change significantly.
The failure of Long-Term Capital Management illustrates how changing correlations can wreak havoc. LTCM observed that the correlation between its diverse investments was less than 10 percent over the prior five years. To stress test its portfolio, LTCM assumed that correlations could rise to 30 percent, well in excess of anything the historical data showed. But when the financial crisis hit in 1998, the correlations soared to 70 percent. Diversification went out the window, and the fund suffered mortal losses. ‘Anything that relies on correlation is charlatanism,’ scoffed Taleb. Or, as I’ve heard traders say, ‘The only thing that goes up in a bear market is correlation.’
Music Lab
Duncan Watts, a sociologist, led a trio of researchers at Columbia University in doing a social experiment. Subjects went to a web site–Music Lab–and were invited to participate in a survey. Upon entering the site, 20 percent of the subjects were assigned to an independent world and 10 percent each to eight worlds where people could see what other people were doing.
In the independent world, subjects were free to listen to songs, rated them, and download them, but they had no information about what other subjects were doing. In each of the other eight worlds, the subjects could see how many times other people had downloaded each song.
The subjects in the independent world collectively gave a reasonable indication of the quality of each of the songs. Thus, you could see for the other eight worlds whether social influence made a difference or not.
Song quality did play a role in the ranking, writes Mauboussin. A top-five song in the independent world had about a 50 percent chance of finishing in the top five in a social influence world. And the worst songs rarely topped the charts. But how would you guess the average song did in the social worlds?
The scientists found that social influence played a huge part in success and failure. One song, ‘Lockdown’ by the band 52metro, ranked twenty-sixth in the independent world, effectively average. Yet it was the number one song in one of the social influence worlds, and number forty in another. Social influence catapulted an average song to hit status in one world–ah-whoom–and relegated it to the cellar in another. Call it Lockdown’s lesson.
In the eight social worlds, the songs the subjects downloaded early in the experiment had a huge influence on the songs subjects downloaded later. Since the patterns of download were different in each social world, so were the outcomes.

(Illustration by Mindscanner)
Mauboussin summarizes the lessons:
- Study the distribution of outcomes for the system you are dealing with. Taleb defines gray swans as “modelable extreme events,” which are events you can at least prepare for, as opposed to black swans, which are by definition exceedingly difficult to prepare for.
- Look for ah-whoom moments. In social systems, you must be mindful of the level of diversity.
- Beware of forecasters. Especially for phase transitions, forecasts are generally dismal.
- Mitigate the downside, capture the upside. One of the Kelly criterion’s central lessons is that betting too much in a system with extreme outcomes leads to ruin.
SORTING LUCK FROM SKILL
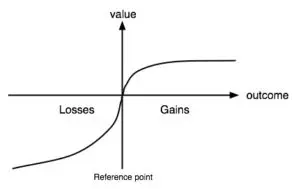
In areas such as business, investing, and sports, people make predictable and natural mistakes when it comes to distinguishing skill from luck. Consider reversion to the mean:
The idea is that for many types of systems, an outcome that is not average will be followed by an outcome that has an expected value closer to the average. While most people recognize the idea of reversion to the mean, they often ignore or misunderstand the concept, leading to a slew of mistakes in their analysis.
Reversion to the mean was discovered by the Victorian polymath Francis Galton, a cousin of Charles Darwin. For instance, Dalton found that tall parents tend to have children that are tall, but not as tall–their heights are closer to the mean. Similarly, short parents tend to have children that are short, but not as short–their heights are closer to the mean.
Yet it’s equally true that tall people have parents that are tall, but not as tall–the parents’ heights are closer to the mean. Similarly, short people have parents that are short, but not as short–their heights are closer to the mean. Thus, Dalton’s crucial insight was that the overall distribution of heights remains stable over time: the proportions of the population in every height category was stable as one looks forward or backward in time.
Skill, Luck, and Outcomes
Mauboussin writes that Daniel Kahneman was asked to offer a formula for the twenty-first century. Kahneman gave two formulas:
Success = Some talent + luck
Great success = Some talent + a lot of luck
Consider an excellent golfer who scores well below her handicap during the first round. What do you predict will happen in the second round? We expect the golfer to have a score closer to her handicap for the second roundbecause we expect there to be less luck compared to the first round.
When you think about great streaks in sports like baseball, the record streak always belongs to a very talented player. So a record streak is a lot of talent plus a lot of luck.
TIME TO THINK TWICE
You don’t need to think twice before every decision. The stakes for most decisions are low. And even when the stakes are high, the best decision is often obvious enough.
The value of Think Twice is in situations with high stakes where your natural decision-making process will typically lead to a suboptimal choice. Some final thoughts:
Raise Your Awareness
As Kahneman has written, it is much easier to notice decision-making mistakes in others than in ourselves. So pay careful attention not only to others, but also to yourself.
It is difficult to think clearly about many problems. Furthermore, after outcomes have occurred, hindsight bias causes many of us to erroneously recall that we assigned the outcome a much higher probability than we actually did ex ante.
Put Yourself in the Shoes of Others
Embracing the outside view is typically essential when making an important probabilistic decision. Although the situation may be new for us, there are many others who have gone through similar things.
When it comes to understanding the behavior of individuals, often the situation–or specific, powerful incentives–can overwhelm otherwise good people.
Also, be careful when trying to understand or to manage a complex adaptive system, whether an ecosystem or the economy.
Finally, leaders must develop empathy for people.
Recognize the Role of Skill and Luck
When luck plays a significant role, anticipate reversion to the mean: extreme outcomes are followed by more average outcomes.
Short-term investment results reflect a great deal of randomness.
Get Feedback
Timely, accurate, and clear feedback is central to deliberate practice, which is the path to gaining expertise. The challenge is that in some fields, like long-term investing, most of the feedback comes with a fairly large time lag.
For investors, it is quite helpful to keep a journal detailing the reasons for every investment decision. (If you have the time, you can also write down how you feel physically and mentally at the time of each decision.)

(Photo by Vinay_Mathew)
A well-kept journal allows you to clearly audit your investment decisions. Otherwise, most of us will lose any ability to recall accurately why we made the decisions we did. This predictable memory loss–in the absence of careful written records–is often associated with hindsight bias.
It’s essential to identify–regardless of the outcome–when you have made a good decision and when you have made a bad decision. A good decision means that you faithfully followed a solid, proven process.
Another benefit of a well-kept investment journal is that you will start to notice other factors or patterns associated with bad investment decisions. For instance, too much stress or too much fatigue is often associated with poorer decisions. On the other hand, a good mood is often associated with overconfident decisions.
Mauboussin mentions a story told by Josh Waitzkin about Tigran Petrosian, a former World Chess Champion:
“When playing matches lasting days or weeks, Petrosian would wake up and sit quietly in his room, carefully assessing his own mood. He then built his game plan for the day based on that mood, with great success. A journal can provide a structured tool for similar introspection.”
Create a Checklist
Mauboussin:
When you face a tough decision, you want to be able to think clearly about what you might inadvertently overlook. That’s where a decision checklist can be beneficial.

Mauboussin again:
A good checklist balances two opposing objectives. It should be general enough to allow for varying conditions, yet specific enough to guide action. Finding this balance means a checklist should not be too long; ideally, you should be able to fit it on one or two pages.
If you have yet to create a checklist, try it and see which issues surface. Concentrate on steps or procedures, and ask where decisions have gone off track before. And recognize that errors are often the result of neglecting a step, not from executing the other steps poorly.
Perform a Premortem
Mauboussin explains:
You assume you are in the future and the decision you made has failed. You then provide plausible reasons for that failure. In effect, you try to identify why your decision might lead to a poor outcome before you make the decision. Klein’s research shows that premortems help people identify a greater number of potential problems than other techniques and encourage more open exchange, because no one individual or group has invested in a decision yet.
…You can track your individual or group premortems in your decision journal. Watching for the possible sources of failure may also reveal early signs of trouble.
Know What You Can’t Know
- In decisions that involve a system with many interacting parts, causal links are frequently unclear…. Remember what Warren Buffet said: ‘Virtually all surprises are unpleasant.’ So considering the worst-case scenarios is vital and generally overlooked in prosperous times.
- Also, resist the temptation to treat a complex system as if it’s simpler than it is…. We can trace most of the large financial disasters to a model that failed to capture the richness of outcomes inherent in a complex system like the stock market.
Mauboussin notes a paradox with decision making: Nearly everyone realizes its importance, but hardly anyone practices (or keeps a journal). Mauboussin concludes:
There are common and identifiable mistakes that you can understand, see in your daily affairs, and manage effectively. In those cases, the correct approach to deciding well often conflicts with what your mind naturally does. But now that you know when to think twice, better decisions will follow. So prepare your mind, recognize the context, apply the right technique–and practice.
BOOLE MICROCAP FUND
An equal weighted group of micro caps generally far outperforms an equal weighted (or cap-weighted) group of larger stocks over time. See the historical chart here: https://boolefund.com/best-performers-microcap-stocks/
This outperformance increases significantly by focusing on cheap micro caps. Performance can be further boosted by isolating cheap microcap companies that show improving fundamentals. We rank microcap stocks based on these and similar criteria.
There are roughly 10-20 positions in the portfolio. The size of each position is determined by its rank. Typically the largest position is 15-20% (at cost), while the average position is 8-10% (at cost). Positions are held for 3 to 5 years unless a stock approachesintrinsic value sooner or an error has been discovered.
The mission of the Boole Fund is to outperform the S&P 500 Index by at least 5% per year (net of fees) over 5-year periods. We also aim to outpace the Russell Microcap Index by at least 2% per year (net). The Boole Fund has low fees.
If you are interested in finding out more, please e-mail me or leave a comment.
My e-mail: jb@boolefund.com
Disclosures: Past performance is not a guarantee or a reliable indicator of future results. All investments contain risk and may lose value. This material is distributed for informational purposes only. Forecasts, estimates, and certain information contained herein should not be considered as investment advice or a recommendation of any particular security, strategy or investment product. Information contained herein has been obtained from sources believed to be reliable, but not guaranteed.No part of this article may be reproduced in any form, or referred to in any other publication, without express written permission of Boole Capital, LLC.